Permitting the American Dream
American Sustainable Affordability Project's platform to solve the housing affordability crisis

Table of Contents
Executive Summary
Introduction
Housing Macroeconomics in 2026
Why is Development Unaffordable?
High Regulatory Fragmentation through Zoning and Building Codes
Pervasive Delays & Permitting Unpredictability
Significant Regulatory & Input Cost Increases
Urban America: Lessons from 2004 to 2024
Sun Belt Growth Engines
California High-Cost Innovators
Established Eastern Municipalities
Policy Reforms
Permitting Approval Time Limits with Deemed Approval Provisions
By-right Zoning for Pre-qualified Builds
Statutory Environmental Exclusions for Infill and Transit-oriented Development
Sustainable Affordability
Conclusion
Executive Summary
America is embroiled in an affordability crisis threatening to derail two hundred and fifty years of progress toward a more perfect Union. The wealthiest country in the world boasts a crumbling housing market defined by several troubling statistics: seven hundred and seventy one thousand homeless citizens suffer in the street, home prices and mortgage cost, as a percentage of income, sit at a forty-year high, and the median age of a U.S. homebuyer in 2025 was fifty nine years old. The housing market is malfunctioning. Young Americans are consigned to homelessness and permanent renting while retirees collect property, calcifying an age-based divide in homeownership. While country-wide macroeconomic missteps like the Great Recession and inflation contribute to the poor health of America’s housing market, the American Sustainable Affordability Project identifies a larger, more addressable issue: undersupply.
Both federal and private audits of American housing supply indicate a multi-million unit deficit between citizen demand and available supply. Simultaneously, American cities permit fewer new builds, anti-density activism prevents apartment construction, and developers pay more in regulatory expenses than ever. The American Sustainable Affordability Project identifies this phenomenon as a broken housing system limiting supply expansion. We propose three primary policy pillars to improve urban supply elasticity: Permitting Approval Time Limits, By-right Zoning for Pre-qualified Builds, and Statutory Environmental Exclusions. Our reforms promote development by improving system transparency, reducing financial uncertainty, and eliminating repetitive lawsuits. Through these reforms, we imagine modernized American cities defined by walkability and well-funded transit, dense housing and lush green spaces, and an end to intrusive highways and single-family sprawl wasting valuable urban real estate.
The report concludes that while natural constraints will inevitably limit development, the most easily addressable barrier to affordable housing construction is poor regulation. Not every reform explored will be compatible with all American cities, but all cities must be willing to admit and remedy policy mistakes for the well-being of their citizens. To restore economic mobility, American cities must outgrow the restrictive single-family zoning regimes of the past and prioritize the rapid expansion of twenty first century housing supply for all citizens.
Introduction
The American Dream is decaying.
American homeownership has never been more expensive. The American affordability crisis is limiting homeownership, forcing renting, and increasing homelessness. Americans are paying more for housing relative to their incomes than ever before. Home prices and mortgages are exploding nationwide while sales are slowing. When did Americans agree that owning a home should be a facet of a luxury lifestyle? Renting is no longer an option for young Americans, it is increasingly the only option. Finally, the homeless population hit a record high in 2024, 771,480 people. In the wealthiest nation on the planet, 23 out of every 10,000 people are homeless. Housing has never been less affordable.
The underlying causes of this affordability crisis are numerous but tied to policies that sacrifice young Americans for the stability of the current economic status quo. Rising interest rates in the last five years coupled with exploding home prices proved disastrous for a generation of Americans seeking the same access to affordable homes and lending enjoyed by several generations before them. Mortgage rate increases limited the turnover of existing homes, reaching a 30-year low in 2023. Building homes became more expensive while residential building permitting continues to decline from 2021 highs, limiting supply. The spiking price of American housing while building and turnover plummet is due to poor policy. The Fed induced a credit crunch to tackle COVID inflation while federal, state, and local policies limit housing supply increases. Tangled in these poor policies, young prospective homeowners suffer the most. Our report explores how to unwind the most restrictive of these policies in order to increase housing supply and drive down costs.
Housing Macroeconomics in 2026
Home price to income exploded in the last five years as referenced in Figure 1. The upfront cost of purchasing a home soared past income growth while the monthly cost to pay the home’s mortgage also surpassed median income growth. Effectively representing the financial burden of a home’s downpayment and mortgage, both rates hit a forty year high in 2022, stabilizing at those rates through 2024.
Figure 1: Home Price to Median Household Income Index
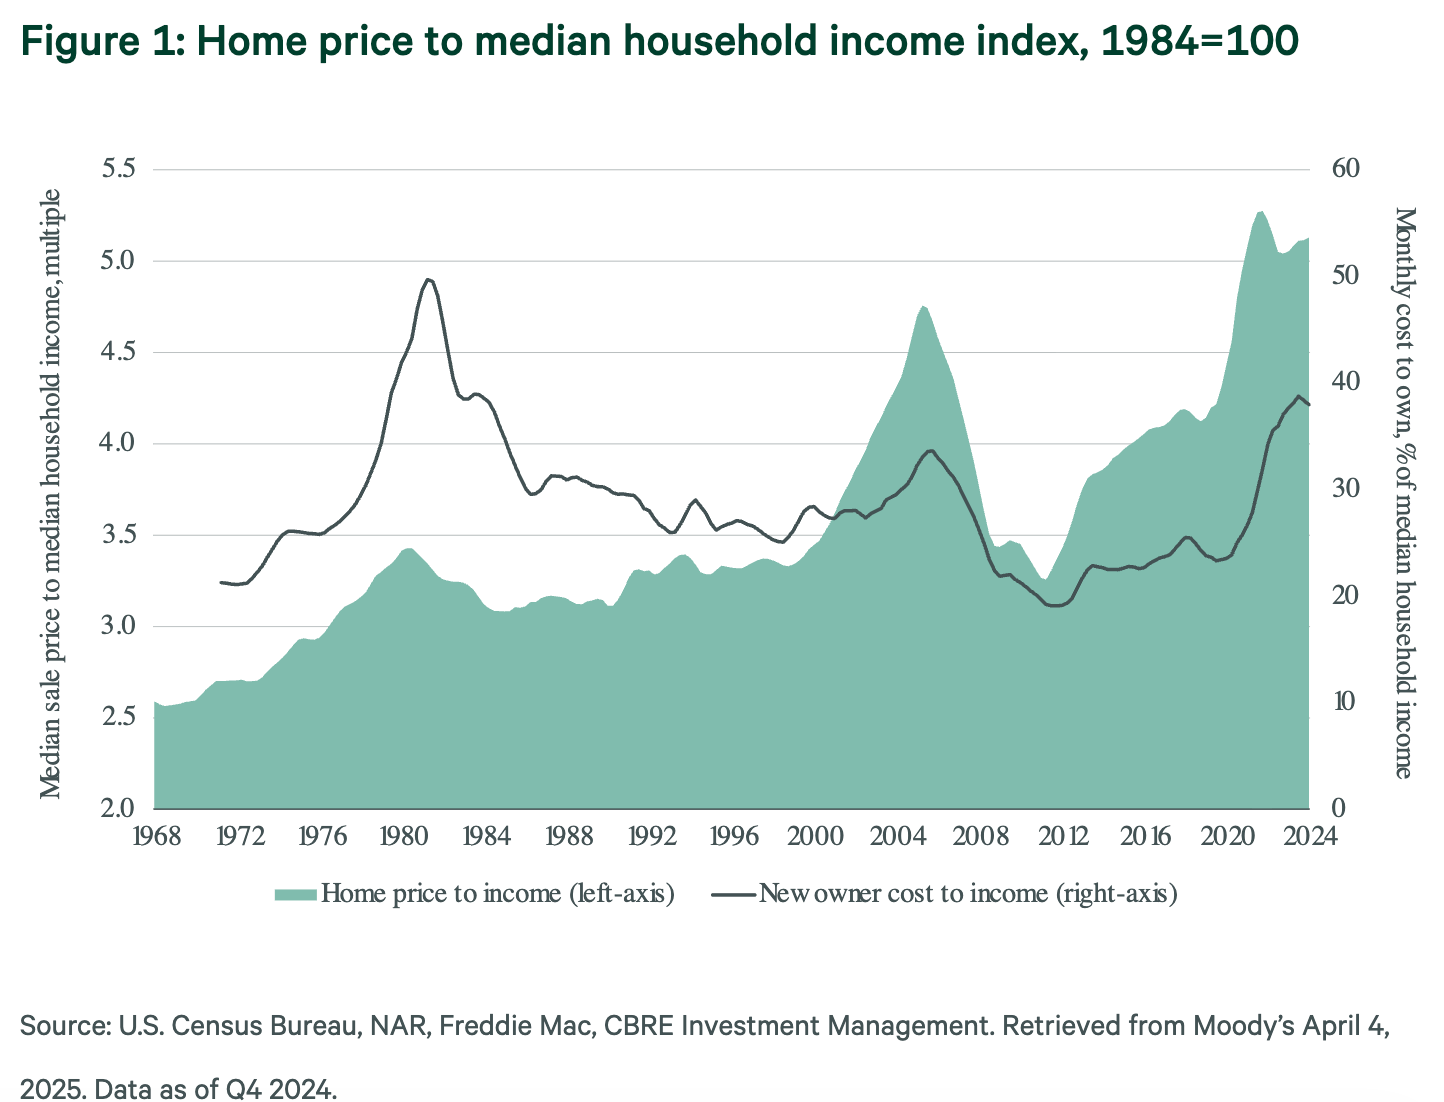
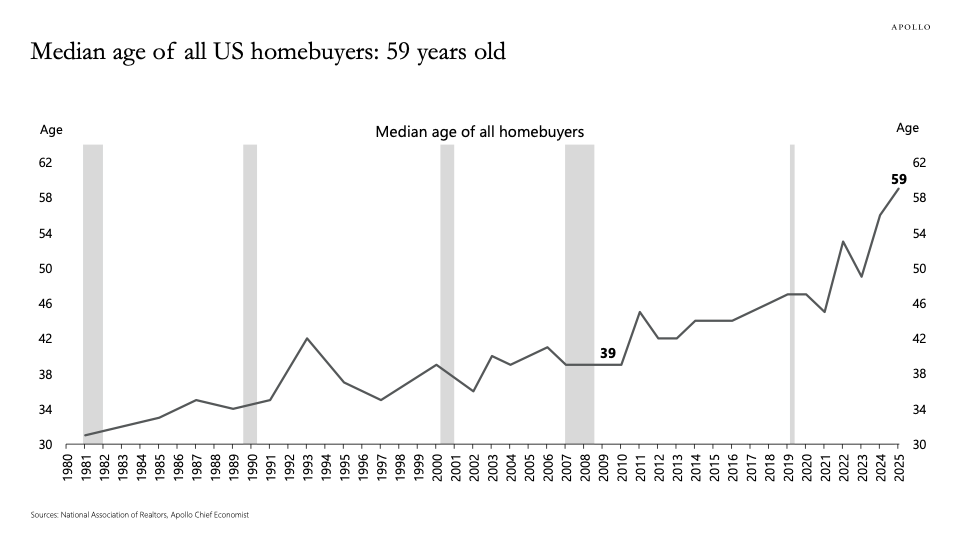
The simultaneous spike of sale price and monthly mortgage is especially troubling due to the implications on asset appreciation. Homeowners experienced a transformational surge in home value since 2012. While beneficial to homeowners, the doubling of median home sale prices from 2012 to 2024 represents a financial asset appreciation younger generations were largely locked out of. The fixed-rate mortgage is not inherently the issue. It remained relatively stable at a low 3-7% rate for the period. However, the historic 2008 mortgage crisis left the economy, housing market, and lenders in an incredibly difficult position. Home prices fell radically but mortgage rates were already low due to well-documented issues in the financial system incentivizing poor lending practices. Cutting rates by over 50% from 7% to 3% did little to spur homeownership when home price to income ratio began increasing again by 2010. Dropping as low as 2.65% in 2021, some millennial Americans locked in a low mortgage on an expensive but appreciating property. Figure 2 reflects the relationship between mortgage rate cuts and increased access by younger prospective buyers, frequently lowering the average age for a brief period. Mostly a short-term fix, the cuts to mortgage rates did not meaningfully lower the average age of homeownership in the country. The previously mentioned doubling of prices from 2012 to 2024 far outpaced a short-term 3% rate cut. Young people simply cannot afford a mortgage on currently elevated home prices while their cost of living continually increases. Meanwhile, homes that are purchased are bought by older and older Americans. The average age of a homebuyer in 2025 was 59, just three years shy of accessing retirement benefits. Older Americans leverage their existing assets to move to a new home or purchase an additional vacation or rental home. The American housing market is functioning with no age-related guardrails as elderly Americans collect more property. The financial mobility of older Americans is positive, but not when the younger generations of Americans are unable to afford a home.
Figure 2: Median Age of U.S. Homebuyers
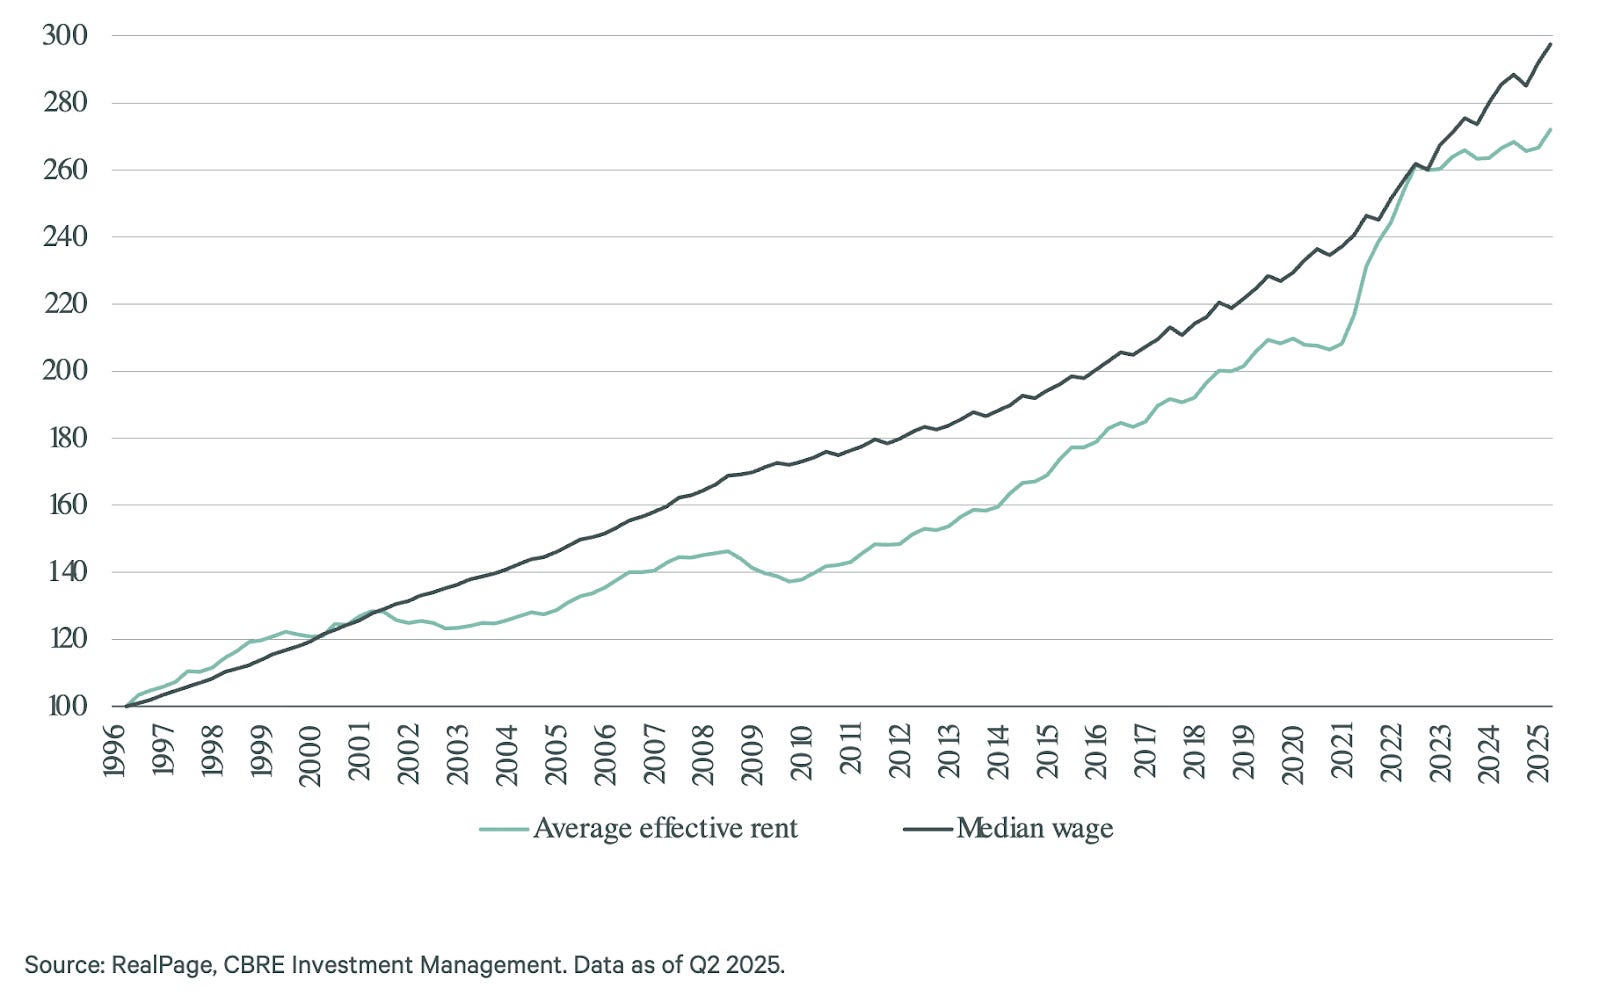
Increasingly shut out of home ownership since the 2008 financial crisis, Americans, specifically young adults, are now renters. Figure 3 depicts the close relationship between rent increases and wage growth over the last thirty years, which stands in stark contrast with Figure 1’s home price to income graph. Driven by larger policy failures, elderly Americans are purchasing housing stock and expanding the rental market. While it is difficult to explicitly tie the relationship between increased homebuyer age to increased youth rental, the number of renters in America grew by ten million, or 25%, from 2008 to 2025. Rent in America financially benefits young adults in the short-term by removing repair costs, appliance purchases, and improving geographic mobility. These features of the renter economy are absorbed as costs of business by landlords, making landlords highly sensitive to young Americans’ wage growth. In the long-term, landlords’ assets appreciate while renters are precluded from this form of wealth-building.
Figure 3: Monthly Apartment Rent vs. Median Wage Index
Home prices are appreciating faster than wages, partially due to increased senior citizen demand with longer life expectancies, increasing population, and growth from immigration; but the price of homes, regardless of type, is increasing due to undersupply and resulting funneling of demand. Specific U.S. housing underproduction, the approximate gap between the number of housing units needed to meet demographic demand and built units, sits at roughly a 3.8 million unit deficit according to Freddie Mac. U.S. housing undersupply began due to the 2008 financial crisis in which institutional trust in residential construction and financial structures plummeted. Subsequent immigration and relocation to high job-growth metros over the next two decades accelerated demand for finite homes, often in already expensive, highly regulated, and low construction regions like California, Massachusetts, New Jersey, and New York. Using simple supply and demand curves in Figure 4 we can explore basic visualizations for this situation and what solutions should change.
Over the long-run, both supply and demand curves should move both to the right as housing supply and demand grow. Rightward demand movements come from population growth pushing the demand curve toward a higher quantity of housing. Corresponding housing construction to meet this increased demand at a market equilibrium price should theoretically push the supply curve rightward, but several issues in the housing development sector currently prevent meaningful supply increases. This is where the American housing sector sits today: increasing demand, constrained supply growth. Some factors limiting supply increases are technological, innovative disruption improving efficiency in the construction market has been negligible since the development of Levittowns and Lustron Houses. Future innovation will likely follow these models of prefabricated homes with a focus on automation in design, preparation, assembly, and demolition. Other factors limiting supply growth are purely policy though. What we visualize through Figure 4 is an aggressive supply increase in housing units.
Figure 4: Price and Quantity Relationship to Increasing Total Housing Supply
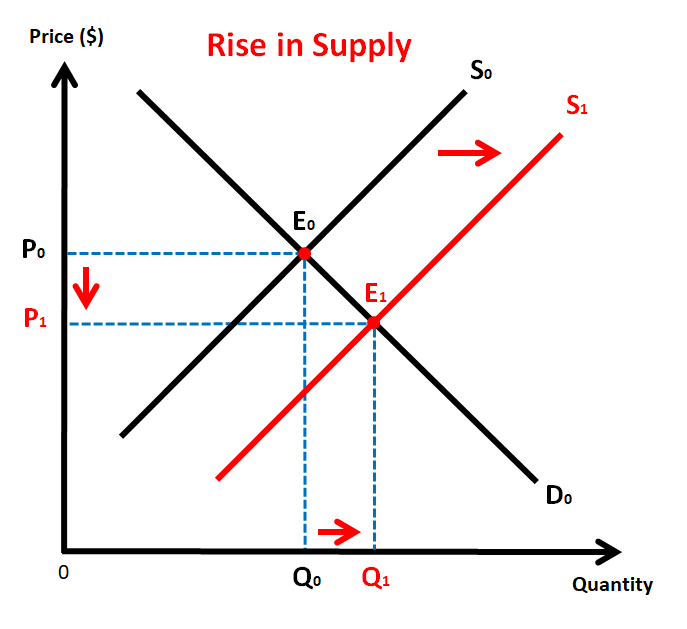
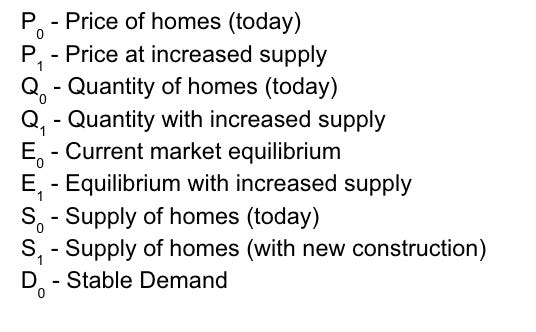
Using Freddie Mac’s 3.8 million housing unit deficit as our equilibrium (E0), we set the current price, quantity, equilibrium, demand, and supply of homes at P0, Q0, E0, S0, and D0. Our primary assumption in this basic analysis is that young Americans are unable to afford housing through homeownership or renting at P0 regardless of a lower mortgage rate as demonstrated in Figure 1 and 3. The current supply curve (S0) is simply too restrictive to current demand and must be increased to S1 to meet consumer demand at a lower price point, P1. Data reflecting this limited supply relationship is abundant, home sales are declining despite prices rising, a key relationship of scarce goods. The markers P1, Q1, E1, and S1 identify a scenario in which the United States is able to accelerate housing production to supply Americans of all ages with dramatic reductions in housing prices.
Readers may pose the question: if housing development is a free market, why is supply not reacting to the high price at P1 to naturally push the supply curve right to S1? In this analysis we will argue that the primary constraint on increasing American housing supply is a poor regulatory environment suffocating economic viability of development. We will analyze data assembled by developers and builders identifying the exact cost of regulation on the total price of an average home. Using data from the men and women trying to build American homes, we argue that overregulation is concentrated in America’s largest cities and will demonstrate this through case studies on the fifteen most populous cities plus San Francisco. What we hope to construct here prior to our policy recommendations is an honest, national-level view from developers on the economic barriers to building in America before identifying specific city and regional-level market issues driving unaffordable housing. We construct this two-part overview on developers and cities to identify: 1.) How the suppliers see the current market economically, 2.) The state of America’s major housing markets today, and 3.) What issues shared between supply (developers) and demand (cities) can be addressed through adopting new policy or eliminating restrictive policy. The first question will be addressed in Why is Development Unaffordable. The second question will be addressed in Urban America: Lessons from 2004 to 2025. Finally, the last question will be addressed in the Policy Reforms section by exploring three policies that attack areas of inefficiency we identify in the first two sections. Not all of the policies recommended will or can be adopted throughout the United States, but each policy recommendation identifies a unique issue plaguing housing affordability in American cities.
Why is Development Unaffordable?
The following section presents how current policy negatively impacts housing supply. We use this section to justify why policymakers must rethink the unaffordable status quo presented in the previous section. While our last section explored the macroeconomic housing deficit birthed from the 2008 financial crisis, this section identifies long-standing policy issues preventing housing supply growth. ASAP believes the macroeconomic conditions like inflation and mortgage rates will self-correct with adequate housing supply. While both issues may require policy intervention, housing supply is directly influenced through legislation while inflation is more structural and independent. The primary policy areas addressed as negatively impacting housing supply include 1.) High regulatory fragmentation through zoning and building codes, 2.) Pervasive delays and permitting unpredictability, and 3.) Significant regulatory and input cost increases.
High Regulatory Fragmentation through Zoning and Building Codes
Regulatory fragmentation as a concept refers to extreme decentralization and lack of uniformity in housing regulation. Regulations in housing often take the form of zoning and building codes. Zoning codes regulate what structures can be built where (residential, commercial, mixed-use) while building codes define the standards constituting safe construction.
Zoning codes are highly diverse with more than 20,000 individual zoning systems in the U.S. with a high degree of variation between them. While many of these zoning systems have a shared origin, the policy drift over the last one hundred years created highly varied zoning regulations. Key examples of zoning policies considered to limit housing density, or the number of units in a given area, include use restrictions, density limits, height limits, parking minimums, and discretionary approval processes. Use restrictions are most commonly used to limit housing density and diversity through single-family-only zoning prohibiting multifamily developments like duplexes, apartments, or mixed-use buildings. Density limits are a more technical tool aimed at slowing population growth per lot, keeping rents higher and total supply lower. Height limits are exactly what the name suggests, they prevent vertical expansion of new or existing buildings that would provide more housing by increasing the number of units. Often, height limits are described as historic skyline or character preservation as a way to soften the policy image. Parking minimums include per unit parking requirements and retail parking mandates, often located in above-ground lots which limit real estate available for housing. Parking mandates are extremely expensive in dense cities due to construction costs mounting to tens of thousands of dollars per spot depending on the complexity. The final policy is quite broad. Discretionary approval is a case-by-case process in which councils or administrators slowly trigger public hearings, one-off permit requirements, review boards, and environmental compliance to slow or halt construction/approval. Discretionary approval is highly varied in level of abuse by zoning district but often lies at the crux of the Not-in-my-backyard (NIMBY) debate. Discretionary approval will be a primary focus in this analysis.
Building code is less controversial and rooted in the historic tragedy of poorly constructed buildings and absent safety measures in East Coast urban dwellings, particularly in the late nineteenth and early twentieth century. Over time, building codes developed to enforce safer construction techniques, limit fire risk, and improve evacuation measures, accessibility, and energy efficiency. While some of these codes are essential (safety and accessibility), other codes including environmental-focused initiatives are often untested with exceptional upfront costs and unproven operating costs. As a whole, building codes are less political than zoning codes, more universal, but can be capital intensive and over-complicated.
Fragmented legal codes represent a hazardous bottleneck for developers. These restrictions are frequently duplicative, overly-complex, and layered in through a century of legislation entrenching a concept such as single-family zoning not only through exclusive zoning but also through fragmented requirements related to setbacks, floor area ratios, or parking minimums. Simply changing the zoning of a lot is seen as a “paper-only” alteration with no practical path forward to changing what can be developed on a lot. Markets with poor acceptance of zoning reform are especially prone to abuse of discretionary approval systems which empower two specific groups: 1.) small zoning approval bodies and 2.) wealthy residents able to manipulate review procedures to stall developers. High regional variation in both zoning and building code prevent any true technological disruption through pre-built homes as it is difficult for builders to use standardized designs or processes across different jurisdictions.
Pervasive Delays & Permitting Unpredictability
The timeline for housing development is variable by regional regulations but follows a general pathway across the U.S. The steps in development are pre-application project assessments (PPA), land-use approval (entitlement), building permitting, financial/organizational preparation (construction prep), and construction. Brian Goggin’s analysis of San Francisco’s development timeline represents this well in Figure 5. We have chosen to dissect San Francisco’s complicated development process to represent the extreme of overregulation in the American housing market. San Francisco provides examples of regulation through historical preservation, discretionary approval, NIMBY petitioning, legal delays, environmental compliance disruptions, contradictory building and zoning codes, and natural barriers to development (earthquakes, oceans, and fire risk), making it an excellent case study for nearly all issues in American housing development. Many of the flaws of San Francisco’s overregulation are also directly transferable to the rest of the country, making it a prime candidate for critique in the hope of inspiring universal policy reform to be exported nationally.
Figure 5: Stages of Housing Development and Construction
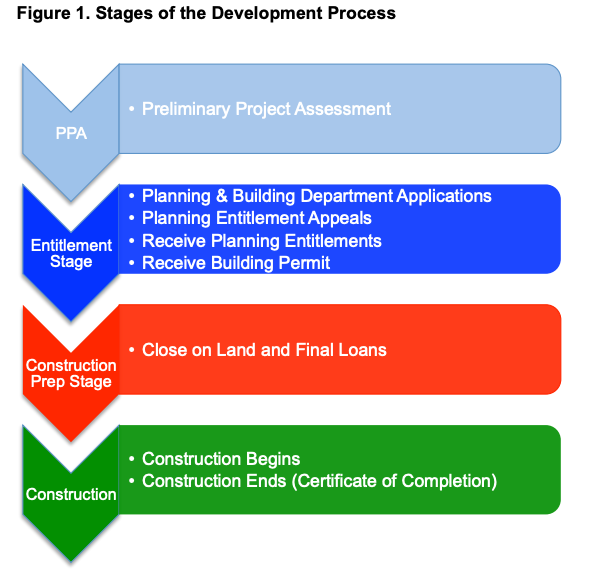
The PPA phase is an early chance for developers to interface with and receive suggestions from local regulatory bodies on their projects. The PPA phase is exceptionally important in intensely regulated or politically active cities like San Francisco. For a city like San Francisco, the Planning Department reviews the developer’s PPA to provide feedback (recommended edits before a final application is submitted) and an expected process timeline for the project’s review. According to Brian Goggin’s process review, developers are also directed to begin community outreach at this point.
From this point, cities diverge significantly on next steps in what is known as the Entitlement phase. In San Francisco, this phase has two core focuses: 1.) Does the development follow existing zoning codes? and 2.) Does the development create negative environmental impacts? The intensity of San Francisco zoning codes, similar to many other over markets like Los Angeles and Boston, frequently require many rounds of discretionary review on “zoning variance, conditional use permit[s], or historic preservation considerations.” The intensity of these zoning regulations force developers to develop twenty first century projects under nineteenth and twentieth century regulations. When a development triggers one of these regulations, relevant oversight bodies (zoning administrator, historic preservation commission, or the planning commission) must schedule public hearings for constituents to voice grievances toward developers and regulators. These regulators are appointed by the Mayor and Board of Supervisors, making them highly sensitive to perceived public backlash. Fairly small multi-unit developments (2,500+ square feet in San Francisco’s North Beach) automatically trigger conditional review processes like §121.1, disincentivizing any non-single-family builds. Further, stifling regulations like §121.1 create extensive delays due to public hearings and costly appeal processes. San Francisco’s regulatory impact is so intense that mid-sized developments (defined by Goggin as 10-50 unit projects) require the same length of entitlement process as 50-200 unit developments. The resulting market is not only infeasible for builders, it is unsustainable for cities like San Francisco actively encouraging economic growth without parallel housing expansion. The second half of the entitlement phase is environmental review, a process in which planning staff, consultants, and developers discuss environmental impacts. A two month review period is considered rapid while the process could extend to two years for larger, more complex developments. Subsequent lawsuits are frequently initiated under the California Environmental Quality Act (CEQA) by “concerned citizens or interest groups,” weaponizing environmental law designed to preserve equal access and sustainable development in order to slow needed neighborhood redevelopment. The added layer of CEQA abuse makes California cities an especially undesirable market for developers. After the above processes on zoning and environmental consideration are completed, the Planning Commission can approve developers’ applications. A final layer of complexity allows any member of the public to appeal to the San Francisco Board of Supervisors and overturn the Planning Commission’s approval. Each of these legal filings by concerned citizens or interest groups places an indefinite stall on developers, effectively creating an unpredictable timeline for all construction projects. The Entitlement phase is defined by overcomplicated, outdated bureaucracy and weaponization of legal systems. For temporal comparison, San Francisco’s entitlement timeline is usually a one to five year process while developments in low regulation markets like Houston complete this same phase in one to six months. The vastly superior speed of approval is owed to Houston’s lack of zoning laws and discretionary delays.
The next two phases of development, Financial Organization and Construction are far more straightforward. Financial Organization focuses on deposit systems between developers and land owners during entitlement proceedings. With approval, land purchase and financing are completed in short order. The developers then must be approved for building permits from the Department of Building Inspection (DBI) if the project design meets building code. DBI then reviews the finished build and approves it for habitation.
Significant Regulatory & Input Cost Increases
As outlined in the above section on Pervasive Delays & Permitting Unpredictability, lengthy and uncertain regulatory processes constrain development efficiency. In this section, we will explore how this unpredictable regulatory landscape passes down cost to end consumers purchasing or renting homes. We will also explore a recent phenomenon of post-COVID pandemic building material price surges.
Figure 6 represents the National Association of Home Builders’ (NAHB) estimated cost of regulation in a new, median value single-family home. For a new home, priced at $394,300, $93,870 or 23.8% of sale price is attributed to regulation. As calculated by Paul Emrath, Ph.D., $41,330 is attributable to regulation costs during the development or entitlement period while $52,540 is related to construction regulation. To start the entitlement period, government application fees and studies on environmental, traffic, and archeological impact translates to approximately 1.6% of total home price paid by buyers. Next, compliance fees after zoning approval include environmental impact mitigation, financial penalties, and utility hook-up fees add an average of 3% to the total price paid by homebuyers. A further 2.8% of total home price is derived from building restrictions in which a portion of lots are not legally allowed to be developed, therefore forcing developers to pay for land without any potential for return. Local regulatory drift over the last few decades has accelerated, leading to variable regional zoning laws. In NAHB’s 2021 survey of developers’ regulatory expenses, 85.4% of developers reported out-of-the-ordinary or unusual design standards imposed through these variable zoning laws. The niche accommodations amount to about 2.3% of home price when applicable. Moving past the entitlement period and into construction, the initial fees for building permits and inspection fees account for 3.1% of final home price. Building code changes or regional variation also impose significant fees on builders, passing fees along to developers and buyers. Approximately 6.1% of the total price of a home can be linked to changes in building codes in the last ten years, another sign of extreme regulatory drift complicating developers’ ability to work across multiple cities. With the above regulatory cost impacts, delays naturally follow while developers and builders meet imposed changes. Cost related to delays, or “holding costs,” lead to lost productivity despite ongoing financial inputs like interest on financing, property taxes, insurance, and general operational expenses. These delays vary in length and impact. Across all of the above categories, NAHB estimates that delays impose a further 0.6% increase on the price of a home.
Figure 6: Cost of Regulation on Single-Family Home Development
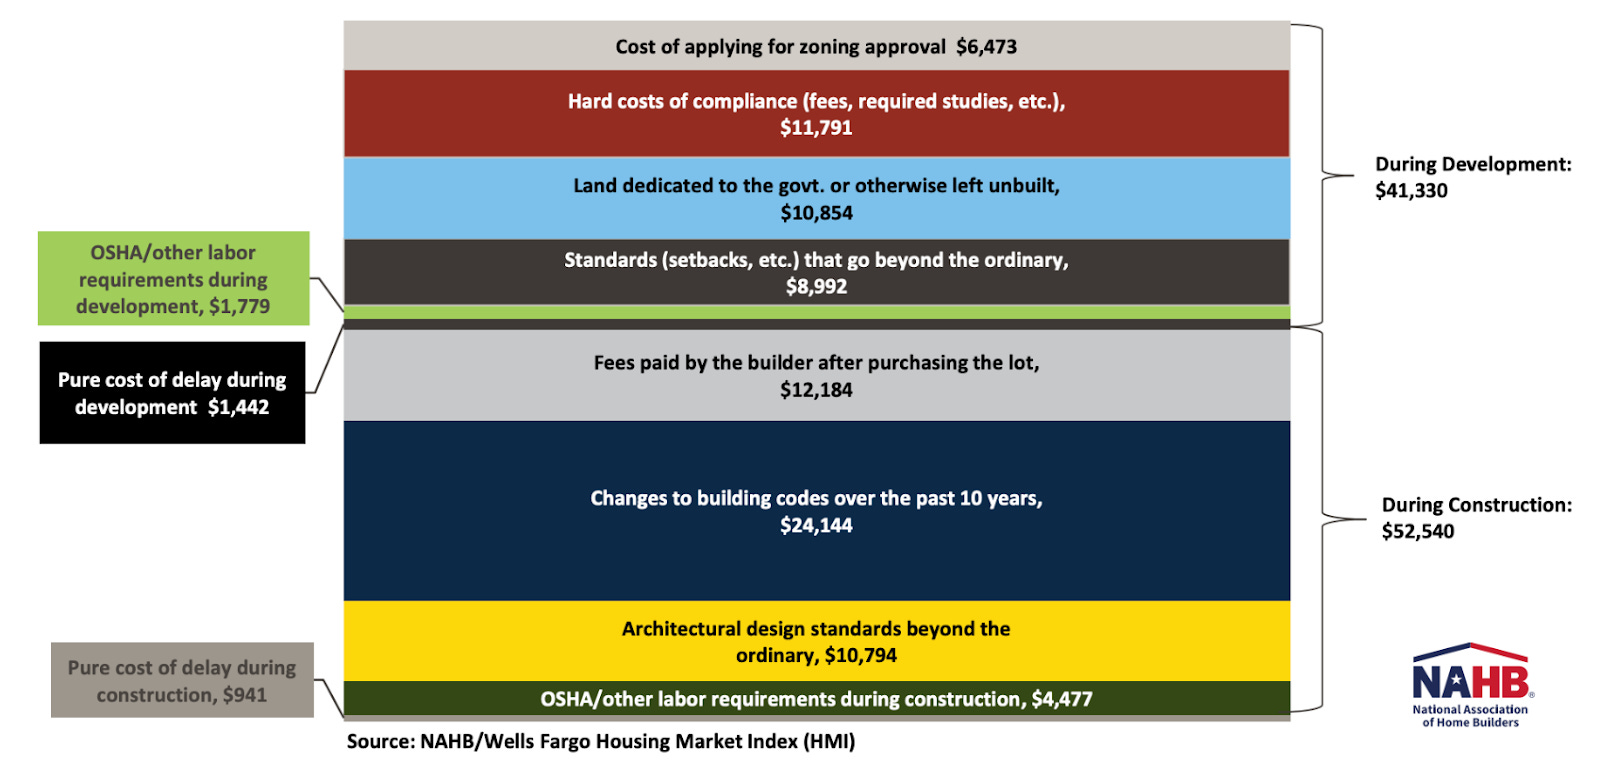
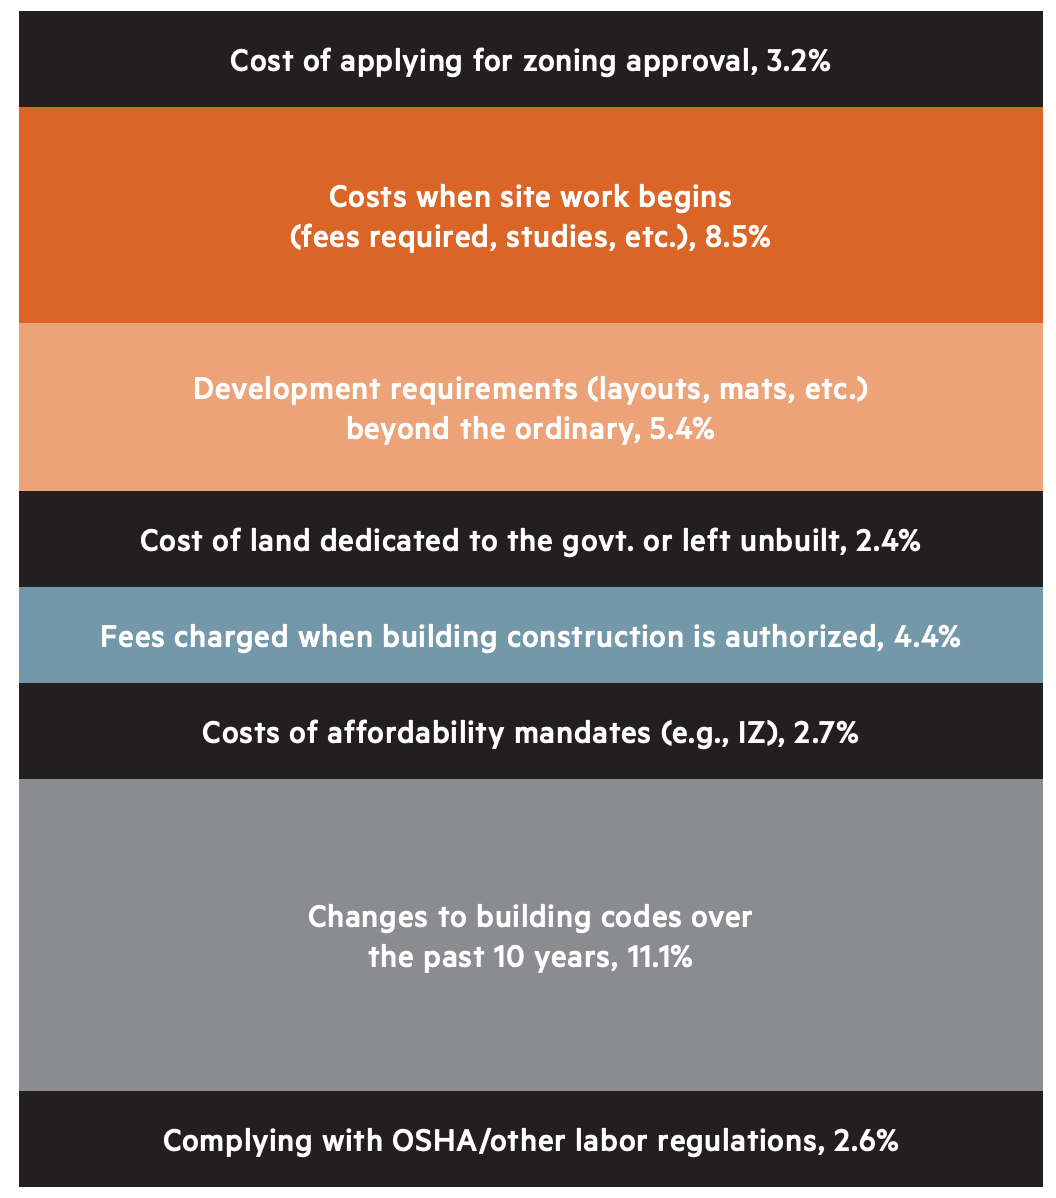
Figure 7 represents a joint NAHB and National Multifamily Housing Council study estimating the cost of regulation on multifamily developments. The study returned an even more startling finding than NAHB’s single-family home review. Approximately 40.6% of multifamily development cost is related to regulatory burden. The National Multifamily Housing Council goes further to link the excessive regulatory burden to increasing rents nationally, identifying higher development costs with higher rents charged to incoming tenants. Unfortunately, the range of data on final multifamily property value prevents direct comparison to the single-family regulatory cost calculations in Figure 6. Multifamily developments identified 11.7% of their total development cost to application fees, environmental studies, and other initial entitlement proceedings. Atypical zoning requirements appear to be less intense in multifamily development than single-family homes, but similar regulatory drift on building codes also create intense efficiency lag and cost ballooning in multifamily developments. Multifamily developments also bear a larger regulatory burden on affordability mandates (usually building a fixed percentage of cheaper units or mandated rent-controlled units) as well as labor requirements.
Figure 7: Cost of Regulation on Multifamily Development as a Percent of Total Development Cost
Material inputs for construction are the most volatile piece of the housing affordability conversation yet go underdiscussed in federal research and policy. COVID-era material prices spiked 150-300% for lumber and steel and 25% for drywall and cement in 2021 and 2022. While material prices did fall from these peaks, volatility continued as restrictive COVID labor laws reduced building material output. The construction industry stagnated as new projects became unprofitable; larger corporations consolidated development projects, driving small builders out of business entirely. Some developers did find a lively retrofit market as Accessory Dwelling Units (ADU) (external units developed on a single-family zoned lot) and conversions were supported through government policy. COVID-era inflation reset material price expectations moving forward, increasing all input prices by about 20% at a minimum even after construction projects expanded in 2023. Figure 8 highlights the unprecedented price increases with tangible effects felt long after the economy reopened in 2022-2023 following COVID lockdowns and contractions.
Figure 8: Cost of Building Materials Pre- and Post-Pandemic
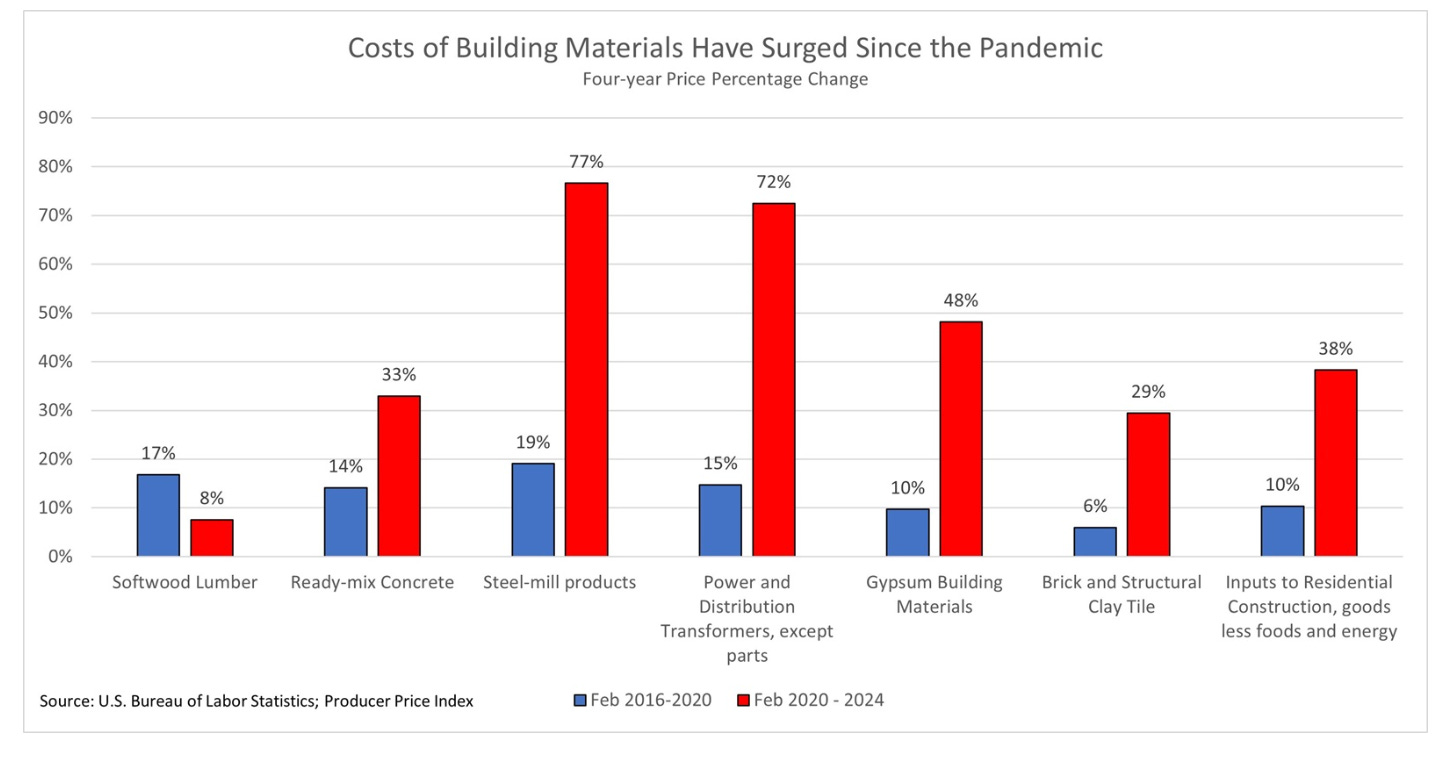
A self-inflicted policy driving price increases is President Donald Trump’s tariff strategy. The construction industry thrives on stable prices and certainty. Specifically, access to cheap mortgages, raw materials, and labor are all high-impact drivers for a booming construction sector. Unfortunately for developers and builders, the second Trump administration inspires uncertainty in inputs with tariffs and a diminishing labor pool. On tariff threats, short-term impacts are already visible. Attempting to spur domestic aluminum and steel production, an initial 50% tariff threat evolved into a patchwork of trade-deals with volume exceptions and carve-outs that raised metal prices an average of 6.3%, passing on an estimated $11,000 per homebuyer as of June 2025. Aluminum prices specifically have increased 40% since this impact estimate from NAHB, likely increasing financial impact on builders, developers, and buyers. As seven percent of U.S. building materials are foreign imports, the ambiguous tariff strategy of the current Trump administration does not inspire confidence domestically in our builders, nor internationally with our trade partners. Canadian lumber may be the best example of this risk. The U.S. sources roughly 85% of its softwood lumber from Canada but has roughly tripled the tariff rate since 2020. The Trump administration is exploring further tariffs around the range of 34.5% for the material in 2026. Not only does President Trump’s strategy do little to encourage the expansion of U.S. aluminium, steel, and lumber production, but tariffs agitate an already weak and expensive construction market while straining relationships in bottlenecked supply chains. On labor, the conversation of reforming the construction labor pool is long overdue. Illegal immigrant labor is not only an unsustainable strategy, it is also a crutch for an expensive construction market America relied on for far too long. Undocumented immigrants compose a minimum of 14-20% of the national construction labor pool. This number spikes in states with some of the highest housing demand like Texas and California, further compounding affordability issues. The construction sector has exceptionally poor financial transparency, often relying on underpaying labor through cash payments, subcontracting, tax filing misclassification, and under-the-table employment relationships. Not only are informal workers at risk of wage theft, wage suppression, and reduced bargaining power, but they have no formal recourse for workplace safety violations. Undocumented immigrants compose a large percentage of these informal workers. The same way that ambiguous, fragmented zoning laws are a threat to efficient development, a contracting, illegally paid labor force is a major risk to sustained housing construction. Reforming both immigration-work systems and labor payment can accelerate a lagging labor pool and solve a pressing legal issue of work status simultaneously, providing a needed boost to development speed.
Urban America: Lessons from 2004 to 2024
A population analysis of America’s fifteen largest cities (and San Francisco) is required before any substantive policy discussion can occur. Austin, Charlotte, Chicago, Dallas, Fort Worth, Houston, Jacksonville, Los Angeles, New York City, Philadelphia, Phoenix, San Antonio, San Diego, San Francisco, and San Jose are America’s largest cities, with the addition of San Francisco to address America’s most important technology market. With varied history and legislation guiding each cities’ housing policy, it is difficult to see similarities other than geographic proximity. From a cursory glance, Figure 9 depicts the growth of America’s major cities over the last twenty years with little surprise. The big cities appear to grow while smaller cities grow more rapidly but remain small. While true, Figure 10 represents the same data, but as a percentage. Viewed from this perspective, the large incumbents like Los Angeles, New York City, and Chicago appear far less impressive with Chicago actually losing population. The other striking trend, that southern cities are experiencing explosive growth over the last twenty years, reveals that some cities are actually succeeding in improving housing stock while America fails in that goal at large. Digging through each city builds a cohesive narrative that America is divided by geographic housing attitudes shaping unique regulatory environments. Shaped primarily by economic conditions and historic rate of development, we can classify regional markets with specific policy approaches. For our analysis we landed on three groups: 1.) Sun Belt Growth Engines, 2.) California High-Cost Innovators, and 3.) Established Eastern Municipalities.


Sun Belt Growth Engines
Austin, Charlotte, Dallas, Fort Worth, Houston, Jacksonville, Phoenix, and San Antonio are the Sun Belt Growth Engines.
Comprising the southern markets, minus Los Angeles and San Diego, these markets are characterized by explosive population growth and urban development over the last two decades. Corporations relocated en mass to this region in the last twenty years, sparking significant economic growth in states with low wages and taxes. Robust white and blue collar job growth defines these markets. Increasing economic vitality lures in white collar job seekers, pushing up demand for housing developed by existing blue collar workers. Similarly, grant programs under the last two Presidents accelerated manufacturing growth in the southern states due to their low capital and operating costs. The Sun Belt governments are capitalizing on a unique economic dividend in which their economies are growing in every sector due to more business-friendly policies and economic inputs compared to America’s east and west coasts. The Sun Belt boom is not an outright success story though. The rapid population growth in these cities is frequently middle to upper-middle class white collar labor. These groups threaten to displace renters, young locals, and blue collar workers unable to afford rising housing costs.
Austin is the post-COVID American city. Austin is defined by high migration from California and other states seeking a lively urban market with cheaper prices and taxes. Unfortunately, Austin overbuilt its expensive single-family stock leading to declining prices and turnover in 2025. A similar apartment building boom dramatically reduced rents on average by 5% a year post-COVID. From 2015 to 2024, the city added 120,000 units to their housing stock. From 2021 to 2023, growth exploded as Austin rapidly permitted and delivered tens of thousands of units per year. As the market softened in 2025, build starts are now down well over 50% in one year. The market chill is most immediately seen in single-family housing but will likely spread to renters in the form of increasing rents as supply growth softens. Austin’s affordable housing climate is experiencing a similar trend of softening. In 2024, the city completed around 2,000 units designed for families earning less than $76,000. Unfortunately, production was cut in half in 2025 with many planned units in a state of ambiguity as financial conditions worsened. Austin’s upper class and renters should enjoy a few years of low pricing if they can secure housing but the historic boom is coming to a close and prices are likely to increase.
Charlotte is rapidly evolving into the financial powerhouse of the South and Sun Belt. The character of the city’s growth is driving its housing market too. Single-family homes and luxury apartments are the top priority for an increasingly white collar city. Both build types are expanding outward, worsening issues of urban sprawl but securing increased housing stock in the short term. Middle class apartment renters are benefiting the most with record construction delivery planned for 2025-2026, driving rents down. It remains unclear how Charlotte intends to increase housing supply outside of builds intended for the upper and upper-middle class. The bottom half of Charlotte residents are now effectively priced out of homeownership as land values exploded, leaving a large portion of the middle class as permanent renters. The city is also experiencing a homelessness spike post-COVID, up about 30% based on fragmented city/county/federal sources.
Dallas-Fort Worth reflects an amplified dynamic of the Austin assessment. A prioritization of single-family homes and luxury apartment buildouts created a bifurcated real estate market where affordable housing was not a priority. Dallas’ population increase has not been as intense as other cities as Dallas’ lack of multifamily units meant the city was far less prepared to absorb newcomers and displaced residents from other cities. The coveted “middle housing” is notably absent in Dallas. Zoning has emerged as a distinct issue area sparking intense debate between Dallas’ single-family communities and housing density advocates. The combined urban area shares many similarities to San Francisco’s ongoing struggle with rezoning an economically vibrant but conservative real estate sector.
Houston is a YIMBY (Yes In My Backyard) policy dreamland. The market does not have traditional zoning frameworks, instead opting for an ordinance system similar to form-based guidelines. Houston’s fast moving development approval and building cycles enables consistent supply growth and downward price pressure. Houston’s corresponding steady, but high population growth benefit from relatively affordable access to housing across all incomes. In fact, lower occupancy rates due to rapid development allows renters more negotiating flexibility than nearly all other cities on the list. Once a leader in affordable housing and homelessness policy, Houston is backsliding. Affordable housing renters are spending record amounts on rent (about 83% are considered extremely cost-burdened and spend over 30% of income on rent) while homelessness is climbing slowly. A model for growth, Houston must start prioritizing the city’s affordable housing cost or risk continued growth in their homelessness population.
Jacksonville’s explosive growth is best explained by a migrating population chasing cheap single-family homes. Buyers moved to Jacksonville from across Florida and many other states to purchase a home at a more affordable price. Continued population growth without a clear policy agenda for two decades left the city with a directionless construction industry chasing the highest return on investment. Settling on single-family homes, Jacksonville developers offer an abundance of properties at nationally affordable prices. Meanwhile a massive affordable housing gap of 50,000 units plagues the city. Recent initiatives are spurring growth here, but the gap widens with rapid and continued population growth.
Phoenix is experiencing a unique version of several trends outlined in the Sun Belt Growth Engines section. Population increase over the last two decades was steady but robust. From 2004 to 2018, single family sprawl dominated development. Large developers purchased swaths of undeveloped land in Phoenix’s periphery and built out Master Planned Communities (MPCs), communities of thousands of single-family homes underpinned by specific design styles with amenities and preplanned street networks. In many ways this is suburban infill, taking peripheral, underutilized land and converting it to low-density housing. The project timelines for MPCs are 10+ years and Phoenix approved over 350,000 units sprawling in every direction of the city’s suburban periphery. While this improved total housing stock, leading to consistent population growth, these units are unaffordable to middle and lower class populations. Phoenix realized this and made a push for urban infill, a process of increasing density of urban cores through developing underutilized or abandoned plots such as single-story retail, manufacturing sites, and former gas stations. Multifamily permitting increased post-2018, slowing during COVID, then experiencing another large uptick as many other Sun Belt Growth Engine cities did. The middle class benefited from this trend as rents lowered in 2025. Rents are expected to tighten as construction efficiency declines due to several of the input cost increases explored previously, namely labor and raw materials. Affordable housing rents lowered as a knock-on effect of construction booms in 2018 and post-COVID. About 4,500 units were added in the last five years, lower than the expected requirements but a healthy growth mostly occurring post-COVID. The unique through-line uniting middle-class and affordable housing issues are rising utility strains. Sprawling MPCs and burgeoning industries like TSMC’s new fabrication in Phoenix control increasing shares of electricity and water distribution. Both utilities are of vital importance in the desert community, requiring careful management of scarce water supplies and electricity needed to power cooling systems for residential and industrial use. Poorly planned decentralized sprawl naturally raises electricity prices, a cost wealthy residents of MPCs easily absorb while middle and lower classes cannot.
San Antonio has a reputation. The reputation is one of stability, smart governance, and straight-forward development. While much of the single-family market has corrected downward in Texas and the rest of the Sun Belt Growth Engine cities, San Antonio remains stable. Home values declined modestly, around one percent per year since 2023. With less construction in the COVID-era boom, San Antonio avoided overbuilding both single-family homes and luxury apartment units. The city did experience a particularly sharp decline in permitting with the beginning of the second Trump administration, likely due to higher material prices and a contracting immigrant labor pool. Rents remained stable while other cities experienced volatile changes. The city prioritizes rapid approval across housing types, including government bond programs to accelerate affordable units. The reputation of smart, balanced governance is well-earned.
California High-Cost Innovators
Los Angeles, San Diego, San Francisco, and San Jose are the California High-Cost Innovators.
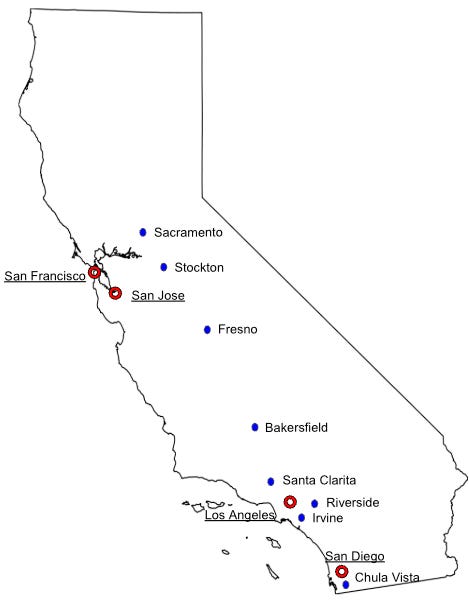
For the California group (San Diego, Los Angeles, San Francisco, San Jose), the markets share identical state policy. All four California cities also share unique civilian resistance to urban densification projects and a legacy of failed government policy. Government policy, in fact, is the primary story of these cities. CEQA, a once celebrated populist reform to ensure air and water quality in-line with federal ambitions, is now a political tool used to generate lawsuits and permitting delays against developers. The use of CEQA as a delaying tactic on multifamily development is especially pervasive in San Francisco but occurs across California cities. A small group of urban single-family homeowners opposed to urban densification are weaponizing CEQA, trapping California’s cities between sprawling suburbs and urban aspirations. California’s unprecedented economic growth did increase population over the last 20 years despite the unaffordable housing conditions. The compromise that unfolded was uniquely Californian. Suburbia extended to dry ranches, farmland, and neighboring cities with cheaper houses. These newly-moved workers commute hours per day, usually by car, to work in the major urban commercial districts of Los Angeles, San Diego, San Francisco, and San Jose to earn higher wages. Figure 11 reflects this unique geographic sprawl contributing to massive population growth in satellite cities over the last 20 years: Los Angeles bled into Santa Clarita (+48.4%), Irvine (+110%), Riverside (+27.5%), and Bakersfield (+59.6%), San Diego bled into Chula Vista (+40%) and surrounding incorporated suburban neighborhoods, San Francisco and San Jose share commuters from Fresno (+26.7%), Stockton (+30.6%), and Sacramento (+22.1%). Uniquely blessed with vitality in technology, entertainment, natural resource extraction, and agriculture, the state’s economic surge in the last half-century powered unprecedented wealth generation but not housing density. A compounding issue here is Proposition 13 (1978), a policy limiting property tax growth and encouraging lifetime ownership of property. Proposition 13 indirectly increases prices of homes by creating government-imposed scarcity and property tax incentives reducing turnover. Densification becomes even more difficult as single-family homes sell rapidly, limiting growth of conversion-style multifamily development. California must address the challenges already mentioned as well as the volatile insurance climate, homelessness, and poor public transit.
Figure 11: California Satellite City-Suburb Relationship


Los Angeles is a sprawling, extensive maze of small single-family homes defined by intense automobile traffic and intrusive highway design. The city is redeveloping slowly, creating small pocks of urban density across the city. These multiple, small urban cores host a homeless population that, while declining for two straight years, still numbers in the tens of thousands across the city. The city was the epicenter of the ADU revolution in the late 2010s and early 2020s. Los Angeles’ biggest policy success of the last decade enabled individual homeowners to build one to three ADUs on their property. The eased permit requirements facilitate a consistently higher unit production but are highly reliant on homeowner financing, not larger financial networks capable of absorbing economic uncertainty. Single-family properties in Los Angeles vary wildly in value. On the lower end, the market commands nearly one million dollars per home. Increasing ADU buildouts and multifamily unit projects are applying downward pressure on rents across the city, offering a fragile middle class relief through options that should be for a housing-insecure lower class. The poor residents of Los Angeles are exceptionally housing insecure. Eventually, ADUs should help lower average rents but as of now, the city suffers a massive affordable housing gap. Los Angeles is trying to build affordable housing near transit hubs, a means to serve the massive populations commuting from cities like Santa Clarita, Irvine, Riverside, and Bakersfield. The relationship with these surrounding cities once again speaks to the unique challenge California’s major cities face: major cities must improve affordability for urban residents, but also find ways to facilitate commuters to support the cities’ continued economic growth. While ambitious, the public transit in the area is severely underdeveloped and future housing production is highly unlikely to reduce the 275,000-500,000 housing unit deficit the city faces.
San Diego stands out from the rest of the California High Cost Innovators in the emphasis the city placed on construction. San Diego’s single-family homes are similar to Los Angeles’ wide valuation range. Inventory is frequently difficult to come by and highly prized but returns a relatively stable 3% growth in valuation. ADUs facilitated some initial growth in the late 2010s before the city led a meaningful growth agenda permitting more than ten thousand units in several consecutive years. A large focus of this development surge was on transit-oriented apartment and multifamily builds. Historically a car-oriented city emphasizing highway travel between its rolling hills, San Diego is investing in public transit and increased density on transit lines. Part of the rationale for intense build-out is the large number of arrivals to San Diego in the last twenty years including veterans or active duty military. Rents in San Diego are declining and look to stabilize at a multi-year low due to continued construction growth. While most development focused on middle class luxury apartments in a previously underdeveloped downtown, affordable housing was developed across the city simultaneously. The city does anticipate a growing housing shortage estimated at around 100,000 units. Pathways to homeownership are considered largely out of reach for San Diego’s lower class with home values in even the most affordable neighborhoods hitting an average of $600,000.
San Francisco is the frontier of bold policy changes designed to push through tens of thousands of units in the next few years. Permitting fast tracks and CEQA exemptions are being applied to affordable housing, transit-oriented developments, and urban infill. It appears these policies come just in time, too. The Silicon Valley AI ecosystem reinvigorated housing demand across San Francisco in 2025. Home sales are approaching all-time highs following the COVID-era software exodus. Turnover speed on single-family homes accelerated to unprecedented levels with many properties on the market for just days. The city, after a few sleepy years lost to COVID, is once again attracting talent from around the world to work for promising AI companies, semiconductor manufacturing, and an enduring software sector. The middle class of San Francisco faces a uniquely challenging rental market. Over 40% of units are rent-stabilized with turnover rates often stretched over a decade. While beneficial for those with access to rent-stabilized units, removing half of San Francisco’s apartments from the market artificially increases the prices of the remaining units dramatically. Policies changing this system at a city and state-level continue to fail due to the perception of eliminating affordable housing. Condominium stock is high but sits at all-time price levels with exorbitant homeowner association fees attached to an average $1.1M price tag. The affordable housing system in San Francisco is extremely complicated with very little renter agency and a lottery system used to connect renters to landlords. San Francisco also hosts the most scrutinized homeless population in the country. For decades the city emphasized a housing-first policy designed to shelter homeless populations without any mandatory mental health, drug abuse, or medical treatment. In the last two decades, the homeless population grew by 40%. Now stabilized at around 9,000 people, the homeless population represents San Francisco’s bottom 1% of earners in a city of 800,000 residents. Not necessarily a large population, the homelessness issue in San Francisco is especially publicized due to the visually extreme wealth inequality and concentration of drug-use. With anticipated cuts to San Francisco’s homeless spending, anticipate the issue accelerating again alongside lower class affordable housing deficits or spreading to the east and south bay regions.
San Jose shares many of the same demand drivers with San Francisco, particularly the world’s most important AI-semiconductor hub underpinned by the largest venture capital firms in the country. Most neighborhoods in San Jose look like a small-to-medium size city but with a surprise: small homes, small backyards, but multi-million dollar price tags. The median home price in San Jose steadily climbed over the last few decades, reaching $1.5M this year. Wealthy AI and semiconductor staff are purchasing and holding homes for decades, locking in exceptional asset appreciation, the nation’s best public schools, and property taxes limited to 2% growth per year thanks to Proposition 13. Single-family homes are not turning-over with any regularity, making multifamily development challenging. Furthermore, urban infill is rejected by the city council and NIMBY homeowners. Rents increase 3%+ annually, one of the highest sustained growth rates in the country. The middle class of teachers, medical staff, and public servants simply cannot afford to pay an average rent of $3,000, often more than half their salary. High occupancy and low construction output further strain renters left at the whim of landlords’ total pricing-power. The city took a hard-line stance toward homelessness in the last few years, eliminating several funding sources for non-profit systems after several damning state audits of mismanagement. While developers prioritize affordable unit construction, the city council and NIMBY citizens fight these projects at every turn and now grow increasingly hostile toward homeless populations. San Jose’s housing market is reaching dire levels of affordability for even upper-middle class residents and is directly controlled by the exceptionally wealthy using homes as an investment tool while displacing the lower classes to cheaper neighboring cities.
Established Eastern Municipalities
Chicago, New York City, and Philadelphia are the Established Eastern Municipalities.
Chicago, New York, and Philadelphia are easy to lump together as they, while historically developing at very different rates, represent America’s oldest, largest urban metros. The three eastern metros also represent key failures other cities must avoid in their own housing policy. Each city is defined by extraordinarily weak policy institutions designed to combat housing unaffordability. In many ways the key failing of the Established Eastern Municipalities is not a lack of financial or political resources, but disjointed government agencies, spending programs, and leaders layered on top of each other that do not work collaboratively. The Established Eastern Municipalities boast the lowest population growth rate analyzed even while their importance in the medical, financial, and technology sectors grew. These cities are denser (politically and numerically) than the Sun Belt Growth Engines and the California High-Cost Innovators, so they will have to be more clever in solving their affordability issues.
Chicago is a unique market burdened by legacies of machine politics and patronage. The city is divided into 50 wards (legislative districts) that compose the Chicago City Council, the city’s central political body in charge of passing ordinances, budgets, and zoning changes. Each ward elects a single Alderperson (representative). Uniquely, these representatives wield an enormous power over their own district in a tradition called Aldermanic privilege. Aldermanic privilege is a unique quirk of Chicago politics. It allows the ward’s representative to informally dictate how the city council votes on planning and zoning on all projects within their ward. Aldermen direct their peers’ votes as they see fit in exchange for supporting other Alderman’s policies when voting occurs. The system is as close to late 1800s American machine politics as any governance structure in the country. Often framed as a means to represent local interests and expertise in developing neighborhoods, the political reality of Aldermanic privilege resembles outcomes of San Francisco’s NIMBY environment. Aldermanic privilege is used to block, delay or even downsize projects with no clear benefit to the public. University of Illinois Chicago research strongly linked aldermanic privilege to underwhelming affordable housing development. The Department of Housing and Urban Development also deemed aldermanic privilege as contributing to economic segregation in 2023 after a five year investigation. Financial gain in office is also rampant with several notable convictions of sitting or formal Alderpersons for bribery, fraud, racketeering, and extortion. Mayor Brandon Johnson is fighting this system, driving reviews on vetoed affordable housing and overturning several decisions. The outcomes of this patronage system are fascinatingly bleak. Chicago’s affordable housing shortage sits between 130,000 and 225,000 units with a unique driver pushing this trend, downzoning: wealthy families are demolishing multifamily units and rebuilding single-family homes. The well-intended but poorly executed Affordable Requirements Ordinance (effectively a targeted form of rent control to increase economic diversity in new builds) further inflames this trend as multifamily and apartment developers reject the high fees imposed by poorly formulated policies. The outcome? Chicago’s housing supply and population is diminishing. The city actually lost 120,000 residents from 2004 to 2024, the only city analyzed to decline in population (Figure 9). Single-family home values grow at a steady 5% rate per year while reduced rental stock consistently pushes rents up 5-10% a year. Chicago never experienced the construction boom many of the cities previously discussed did. Renters are subsequently caught between unaffordable single-family homes, declining stock of multifamily units, and extreme competition for a small number of new apartments. As it stands now, the single-family class is consuming or blocking the development of lower and middle class housing stock at an alarming rate.
New York City looks set to truly tackle a massive housing affordability crisis under new Mayor Zohran Mamdani. Similar to Los Angeles, New York City deals with a significant issue of homelessness. Hosting the largest homeless population of any city in the country (well over 100,000 people), the city also contains a further 200,000 people without secure housing. Some of these people are housed in government shelters, some are unhoused, and others self-report as regularly moving between shelters (usually friends, families, and motels). The CityFHEPS program spends over one billion dollars per year supporting poor New Yorkers at risk of homelessness and eviction yet the homeless population continues growing. CityFHEPS is a frequent target of waste, fraud, and abuse claims. Robust spending on CityFHEPS has not solved issues of lower class housing insecurity either. New York City has added over 300,000 new residents since 2004 with minimal affordable housing construction in the same period. Some boroughs are performing better than others on affordable housing though, with The Bronx expanding their share of affordable housing units by “33 percent between 2016 and 2019” and “almost 44 percent between 2020 and 2024.” Brooklyn also sped up affordable housing construction while Staten Island stands out for underwhelming growth. Manhattan did expand housing supply by 7.9% from 2010 to 2024, but most of the development seems concentrated in expanding higher-end units. Cyclical permitting fluctuation tied to inconsistent political support and developers’ sensitivity to profit margins resulted in inconsistent delivery of new units. Rents appear to be stabilizing in the $3,000 range due to recent emphasis on construction in less-dense boroughs. It remains unclear if the new surge in construction will deliver enduring price decreases or if it will be more ephemeral like many of the Sun Belt Growth Engines. New York City’s pre-1974 housing usually falls under rent stabilization programs with exceptionally high occupancy and low turnover. Similar to San Francisco, approximately 44% of units fall in this category, cutting the city’s total inventory in half and creating artificial bottlenecks on market-rate units. The city’s vacancy rate is far lower than the national average, usually sitting at 2% or so. With minimal turnover, an increasing economic pull owed to technology and finance companies, and artificial supply bottlenecks, market-rate units are exceedingly expensive and subject to extreme competition between renters. The upper class of New York City faced a 10% backslide in property values from 2022 to 2023 but prices soon hit all-time highs in 2025. The market is expected to return a 5% increase in valuation per year. Already considered inaccessible for nearly all New Yorkers, property ownership is now facing a fierce showdown with Mayor Mamdani looking to extract new streams of revenue from property owners.
Unfortunately, our last city overview is one of the bleakest. Philadelphia remains relatively affordable compared to other cities analyzed, but not for its own residents. With roughly 6% population growth over the last twenty years, Philadelphia outpaced Chicago and New York City, likely due to its cheaper rent and home values. Median home prices climbed roughly 50% from 2018 to 2022 with a small stabilization since. We anticipate home prices to increase rapidly as New Yorkers move to Philadelphia and regularly commute similar to the California High Cost Innovators’ relationship to their neighboring cities. Rent and condo prices declined between 5-10% over the last several months, providing a small window for both upper-class Philadelphians and commuters from New York. Vacancy rate sits around the 7% mark, indicating higher renter leverage and low demand. Supply seems likely to tighten over the next few years though as new permitting stagnates with an anticipated 64,500 unit affordable housing deficit. Competition between middle and lower classes over affordable multifamily and apartment units seems increasingly likely. Discussions are ongoing between city leaders to establish a two billion dollar bond program to preserve and expand affordable housing stock. The lack of concrete policy direction and larger plans outside of bespoke initiatives speaks to poorly coordinated public-private development relationships in the city. Philadelphia seems wholly unprepared for the possibility of tens of thousands of New Yorkers moving to the city and causing mass displacement. While not a foregone conclusion, the rapid spike in housing prices does indicate this trend is already occurring. Unfortunately, it may be too late to stop.
The three regional groups we created represent how America’s largest cities are doing on affordability at three very different stages of growth and regulatory intensity. While helpful to separate America’s major cities into regional and thematic groups, similar and consistent themes emerge. Negative externalities from poorly-planned policy can be incredibly damaging to lower-middle class populations and a city’s overall economic growth. Excessive regulation does force supply to become inelastic as governments impose artificial growth restrictions. Thankfully, property values can be reset to a healthy equilibrium from a sustainable supply growth over time. Eliminating restrictive zoning requirements or repetitive environmental review improves supply elasticity. Governments struggling with housing affordability must intelligently reform their development procedures if they wish to improve their middle and lower classes’ housing experience. ASAP identifies the best pathway forward to reduce home and rent prices therefore producing age-and-income diverse cities is increasing supply. For that reason, the next section on policy reforms focuses explicitly on improving housing supply.
Policy Reforms
The policy reform section of this report analyzes three specific proposals in the permitting process to maximize developer and bureaucratic efficiency. The primary objectives we screened policies through were: 1.) ability to accelerate development speed, 2.) cost reductions, and 3.) potential to increase housing supply. Accelerated development speed is measured by timeline reductions starting at permitting and ending with finished construction. Cost reductions are quantified using developer-reported expenses, reduced legal fees, and explicit changes to permitting fees. The ability to increase housing supply is determined by new builds and retrofits completed after the policy is enacted, when data is available. In the absence of tangible data, we will provide prospective outlooks on increases to housing supply.
For our analysis, we analyzed innovative policies at a state and city scale. Many of our case studies focused on building codes, discretionary zoning, and environmental restrictions, three key obstacles in development efficiency as noted in Figures 6 and 7. Obvious limitations exist in exporting policy from intensely regulated markets like San Francisco to low-zoning markets like Houston. Our analysis focused on regimes like California, New York, and Minneapolis who are confronting decades of poor legislation with precision policy change instead of highly cyclical markets Texas, Nashville, or Arizona who historically avoided intense regulatory intervention. High-regulation markets serve as excellent case studies for exploring efficiency improvements as eliminating overburdensome regulations moves these markets closer toward the free market ecosystem already visible in the Sun Belt Growth Engines. While broad deregulation is not the end goal, the elimination of specific regulations that artificially bottleneck housing supply growth is a priority. ASAP views the extreme, government-created failings in markets like San Francisco, San Jose, Los Angeles, and New York City as directly addressable through policy while cyclical markets are far more difficult to regulate into stability.
Each proposed policy reform is examined as follows: overview, policy mechanism, real-world case studies, timeline impact, cost impact, and risk mitigation strategies. The policies explored in this section are 1.) permitting approval time limits with deemed approval provisions, 2.) by-right zoning for pre-qualified builds, and 3.) statutory environmental exclusions for infill and transit-oriented development.
Permitting Approval Time Limits with Deemed Approval Provisions
Permitting approval time limits are designed to combat administrative delays and provide a clear, predictable, and efficient review process for developers.
Policy Mechanism
Passed via state-wide legislative action, the permitting approval time limit, sometimes colloquially called a “shot clock,” forces local and state agencies to render a decision on zoning permit applications within a defined window. The time window for approval usually ranges between 45-120 days on the rapid end to one year on the slower end. A defined approval window directly increases financial viability by giving developers predictable timelines, stabilizing financial planning, and clarifying cost projections and risk. The core penalty motivating regulatory efficiency varies once the time limit has expired but must either reward developers or punish offending agencies. The most impactful tool is automatic approval, or “deemed approval,” for developers (projects are still required to meet all objective regulatory thresholds in their application but may proceed to building phases). Deemed approval is a method of bypassing discretionary review and usually requires governing bodies to create or clarify a set of objective standards. Weaker penalties for shot clock violations may refund application fees to developers or open legal proceedings against regulatory bodies to initiate objective review. These alternatives to automatic approval are objectively weaker as they only penalize regulators, and in some cases developers through necessitating legal proceedings, but do not advance development timelines. Forcing developers to sue the city if the approval time limit expires also comes with a “reputational tax” as described by Brain Goggin. Legal action against the city is viewed as a last resort that may permanently damage a builder’s professional reputation and future relationship with city officials.
Even when a time limit or deemed approval provision is enacted, many NIMBY city approval bodies develop defensive tactics to slow developers. Approval bodies may provide a temporary denial or stay to freeze the development past the time limit only to deny it later under discretionary review, completely avoiding the deemed approval threat. Negligent data collection has also been effectively mobilized as a delay tactic. The San Francisco Planning Department began neglecting data collection around application dates after the passage of the Permit Streamlining Act (1977), making a time limit functionally impossible to enforce. While clear timelines for permitting decisions are helpful by themselves, deemed approval provisions attached to the timeline with strong, court-initiated enforcement are the key to creating a permitting approval time limit with clear preference for development. Strong, court-initiated enforcement would require judicial cooperation but relieves developers from reputational harm and counters city officials’ attempts to delay or stall out developers. It is important to note that deemed approval provisions refer to automatic approval of land use entitlements and/or subdivision plans, not automatic issuance of environmental compliance or construction permits. Approval for construction still requires environmental compliance and building code review. That said, deemed approval provisions on environmental compliance policies like California’s CEQA are very similar to those outlined above and can be addressed with more encompassing deemed approval provisions. We will explore an example of CEQA deemed approval provisions in the statutory environmental exclusions section. The following case studies explore a specific, enhanced version of time-limits with deemed approval provisions that utilize ministerial approval (the elimination of all discretionary decisions or public hearings) to facilitate quicker review processes in both zoning and CEQA reviews.
Case Studies
After dozens of attempts in California to reform broken urban entitlement review processes, the state seems to have finally made an important headway. The Permit Streamlining Act (PSA) was designed to force regulators and local jurisdictions to render final decisions on housing developments within one year of application completion. If the agencies missed this deadline, the application could be deemed approved as long as the developer sued the city. As discussed in the permitting mechanism section, cities like San Francisco have not operated in good faith with these provisions, informally penalizing builders who sue the city through blacklisting them from future approval on new projects, issuing temporary rulings to bypass the time limit, and intentionally not collecting data on development submission to avoid initiating a time limit. PSA was unable to advance significant development in urban markets, leading to extreme variation of expected development timelines across the state. For example, in 2023 the average Rio Vista development approval timeline was 14 days while the same process took an average of 1,204 days to complete in San Francisco. Obviously San Francisco is a more complex development market than the relatively rural Rio Vista. Yet, the staggering difference in approval timelines reveals that the culture of slow entitlement approval is local and not related to statewide policy errors. Senator Scott Wiener used growing public demand for affordable housing as a way to enhance PSA’s approval time limits using both court enforcement and ministerial review in SB 35 (2017) and SB 423 (2023).
First passed as SB 35 in 2017, Wiener’s bill created a ministerial approval pathway bypassing city discretionary review and CEQA litigation in areas failing to meet state-determined goals for housing units. Defined under the Regional Housing Needs Allocation (RHNA), the California Department of Housing and Community Development (HCD) splits populations into quartiles by median income per city, town, and county. HCD then projects how much housing is needed per quartile in each region based on the region’s anticipated population growth over an eight year forward projection. The RHNA process is intensely criticized across the state as both over and under calculating housing needs. The California State Auditor submitted open criticism of both RHNA findings and data methods but these went unchanged. RHNA data is not based on consistent, empirical evidence according to the state auditor’s 2022 report. Unfortunately, the failings of RHNA cast a shadow over any success the program may have due to data replication issues and political influence. Refocusing on the policy mechanisms of SB 35, ministerial review bypassing local discretionary zoning and lengthy CEQA reviews is triggered when a region fails to meet RHNA designated annual progress toward lower or middle class housing goals. The trigger opens a one year window for intense housing development in which projects that elapse a 60-90 day time limit are automatically approved with court enforcement if they are consistent with these objective zoning standards: providing a set number of units (either 10% or 50% of total units built) for populations earning less than 80% of area median income, hire all staff at a regionally-set minimum wage, and falls under the general confines of “urban infill.” SB 423 extended SB 35 until 2036 while expanding operational scope to coastal areas and increasing labor and affordability measures.
Scott Wiener’s affordability streamlining project has both positives and negatives. First and foremost, the RHNA is a poorly-run system and should be removed as the key trigger for ministerial review. RHNA’s data hygiene is unprofessional and skewed by predetermined goals that are not attached to tangible, verifiable, or reproducible data. Retaining RHNA as the primary trigger for ministerial review weakens the credibility of both bills. Additionally, the lack of a strong deemed approval clause forces developers to sue cities when cities dispute permitting applications. While SB 35 does lead to strong court enforcement, the surviving PSA lawsuit dynamic damages developer-city relationships, impeding sustainable growth. City planning commissions can still use disorganization in data management as a stalling tactic to delay time-limits from starting or being enforced. From a purely economic perspective, SB 35 and its extension SB 423’s standards on labor and affordable units seem to be a political maneuver to get an aggressive housing policy over the line. The additional labor costs related to “regionally-set wages” stem from an ambiguously determined rate set by California’s Director of Industrial Relations. These wages are 10-40% higher than the market-rate. The “prevailing wage” is frequently correlated to union-level wages, indicating another layer of political influence on the policy. The emphasis on developments with 50% of units meeting affordable criteria is unsustainable. Building these units is not profitable, forcing developers into unique financial structures with high reliance on tax-credits and bond programs that increase government financial burden. Improved access to units at 50%+ of market-rate provides immediate stability to poor populations in urban areas, but this provision should be phased out as lower priced units begin to offset the need for government subsidy programs. With these issues in mind, the program has accomplished a tremendous task. Bypassing CEQA review, public hearings, planning commissions, and discretionary review allows developers to meet established code and build quickly. San Francisco reported new permit approval data altering average timelines from two years down to six months since the passage of SB 35. The additional focus on affordable housing solves immediate need for cities like San Francisco’s eroding lower-middle class. State-wide data also appears promising with over 40,000 new units delivered through ministerial review. While the requirement for developers to sue city planning authorities should be replaced with automatic deemed approval to safeguard the two parties’ relationship, the policy can already be considered a success with future alterations likely aimed at reducing need for state subsidies and identifying a more reliable and defensible trigger outside of RHNA.
The urban California housing market, especially in San Francisco, was deemed a crisis by Sacramento legislators identifying local authorities as unable to expand housing supply. SB 35 directly challenged the calcified approval process rewarding sluggish city planning authorities opposed to urban infill and affordable housing. The policy challenged city authorities by restructuring jurisdiction away from local planning bodies wary of multifamily development, toward state-backed lawsuits enforcing rapid permit application timelines. Relying on a conditional ministerial approval process and active courts, SB 35 and SB 423 are successful policies but highly vulnerable to city delaying tactics.
Timeline Impact
The impact on development timelines appears significant in San Francisco. The California Senate estimates that the average entitlement period decreased by 56% statewide. In San Francisco, the state’s key NIMBY hot-spot, city officials estimate the permitting timeline decreased by 75%. Urban areas still require far more time to permit than the state-average though, usually a minimum of 50% more time.
Cost Impact
Estimating exact cost savings is difficult. Undefined savings include reduced financing burden, lower exposure to inflation of building materials, and lower financial overhead. Using the methodology from the Significant Regulatory & Input Cost Increases section, single-family developers endure approximately 6.9% of cost during the entitlement period. A significant 2.3% of these expenditures are related to discretionary demands from local authorities. Multifamily developments endure a similar 7% of cost during this period. Deemed approval and time limits are unlikely to eliminate the whole 6.9% and 7% of cost but can reduce a large portion of the discretionary demands and excessive case-study expenses. In addition to the undefined financing savings, approximately 2.5-5% of cost reductions can be expected in the development phase operating under this expedited timeline.
Risk Mitigation Strategies
Litigation filed by developers against cities causes unnecessary reputational harm, damaging the overall development ecosystem. For this reason, initiation of legal proceedings as a penalty for missed approval timelines should be avoided. The likely pathway here is to alter the court-enforced ministerial approval clause in SB 423 to an automatic deemed approval granted by the state, by-passing local challenges or legal proceedings.
As mentioned previously, urban projects are challenging. Additionally, affordable housing, the target of SB 423 and most urban policies, is far more financially complicated than standard multifamily developments. Eliminating the need for subsidized programs or affordable housing requirements in SB 423 after enough development would prevent over-development or unnecessary subsidies in a low-cost environment. An additional complexity in SB 423 is balancing the need for impact assessment with the NIMBY politicization of these tools. Rushing development could have extreme impacts, approving poorly designed or unsafe projects. One avenue to avoid this outcome is pursuing staffing expansions in approval agencies. Operating more efficiently with larger staff, these agencies should improve system efficiency as well.
By-right Zoning for Pre-qualified Builds
By-right Zoning for Pre-qualified Builds avoids discretionary review and incentivises pre-approved development through clear legislative standardization.
Policy Mechanism
Passed as a state-level override of local zoning authorities, state legislatures can install by-right approval for projects meeting specified thresholds (affordable units as a percentage of total units, proximity to transit systems, specific zoning code elimination) triggering a ministerial review of projects. The by-right, ministerial review bypasses discretionary review. The process is also called administrative review. By-right zoning entitles citizens and developers to approval on projects that meet exact code specifications from planning bodies. By-right zoning effectively removes any discretionary influence from approval agencies. The state establishes strict criteria for zoning and building standards based on local codes, but no formal environmental or public hearings are held. Once cleared through the objective ministerial review process, developments move on to building code review. Case studies for by-right zoning are exceptionally limited but do exist in markets aiming to reform city-wide zoning laws in one legislative action. Instances of city-wide upzoning (eliminating single-family or non-residential zoning to increase density) or governments explicitly prohibiting the downzoning (reducing density) of lots accomplish a similar goal to by-right approval without the need for a qualifying threshold as outlined in the first sentence. For this reason, we will explore upzoning and anti-downzoning policies as a proxy for by-right zoning in this section. These policies have all been tested in urban markets across the U.S. with success in reducing development cost while increasing affordable housing supply and urban density, especially in transit hubs. We will also reference each of the strategies above (ministerial review, upzoning, downzoning bans) in how they relate to the second piece of this policy, pre-qualified builds.
Pre-qualified builds are a portfolio of building templates or architectural designs vetted by individual jurisdictions for building and zoning code compliance. More a municipal tool than a state-initiated policy action at this point, pre-approved builds allow for rapid, but locally-dictated development. The policy tool is most applicable to municipalities increasing urban density or total housing supply but with limited traditional parcels for development. Pre-qualified builds are especially helpful at promoting infill on vacant, underutilized, or damaged lands, as well as improved development viability in historic architecture districts. Accessory dwelling units or ADUs (usually studio to two bedroom external additions to a property), are an excellent example of how medium to large single-family parcels can quickly construct additional housing units. Giving homeowners the right to build these structures through by-right zoning, then offering a catalog of municipality-approved building templates fast-tracks increased density in areas with high single-family zoning. While often not a large, city-wide issue, areas with intense historic architectural regulation are far less likely to support ministerial review or pre-approved build policies. These areas are more restricted by style codes and other cumbersome regulations, sometimes prohibiting any substantive external renovation or additional construction. In the absence of state regulations, some municipalities still authorize ministerial review and design hyper-localized building plans or compatibility guidelines to increase housing supply while retaining cherished stylistic themes. Projects aligning pre-qualified building standards with upzoning and/or downzoning bans are especially useful in understanding how to increase density in brownfields and communities serviced by public transit. Brownfields are neglected commercial/industrial properties with varying levels of environmental contamination requiring remediation. In cases without industrial level chemical contamination, brownfields can be safely remediated and converted to residential zoning. Commercial viability is exceptionally complicated, even in low contamination properties, due to the added cost of remediation though. Developers shy away from brownfields due to the excessive environmental review burden the projects entail. However, government agencies pushing construction agendas frequently provide grants, tax credits, and liability protection to developers willing to remediate brownfields. In other cases, governments remediate these areas themselves. The pre-qualified build policy stack is uniquely designed to counteract the additional financial burdens in remediating brownfields. By establishing pre-qualified building designs (usually density ratios, mixed-use specifications, and public space allowances), parcels are administratively approved following costly environmental studies and review in the remediation process, offsetting total entitlement stage cost and timeline. By-right zoning is usually not required to push through projects on brownfields but can be helpful for strict multifamily development targets through upzoning.
By-right zoning as a policy pairing with pre-qualified builds is incredibly effective in major public transit hubs. As public transit infrastructure remains immature in the United States, this issue has only just entered policy conversation over the last few decades. When transit routes intersect with brownfields, cities can easily dictate preference for large affordable housing or high density development. When transit routes overlap with active commercial and residential zoning, cities have far less control in dictating housing density due to NIMBY activism. Downzoning bans prevent housing density decreases, but do not explicitly accelerate housing density. To guarantee increased housing density in transit areas, sweeping upzoning removes density caps in target neighborhoods and forces the development of apartments and multifamily units. If upzoning is not possible, providing multifamily zoning via by-right approval, if located within a certain distance of transit lines, often incentivizes rapid density increases. Government sponsored pre-qualified building plans then expedite development in urban transit cores via clear, previously-approved building plans meeting all zoning and building code requirements. Stacking pre-qualified multifamily building plans with automatic upzoning or by-right approval for multifamily developments provides a sweeping policy tool for increasing urban density and reducing developer cost and timelines, all while avoiding costly neighborhood quarrels in discretionary review.
Case Studies
The Minneapolis 2040 Comprehensive Plan is a city-wide urban revitalization program that clearly defined several economic and social objectives for the city’s future. Passed in 2018 and effective since 2020, Minneapolis 2040’s core focus is shared by many American cities: develop housing that is affordable, diverse in style, and holistic in function that promotes continued economic and population growth. The policies enlisted were numerous but primarily fall under the by-right zoning piece of this policy stack. For that reason, we will use a second case-study to analyze what a combined by-right zoning and pre-approved build policy stack looks like in practice.
The primary housing aim of Minneapolis 2040 was simple: eliminate urban single-family zoning and streamline the entitlement phase for developers. The actual implementation proved more difficult than it sounds though. After battling legal challenges through 2023, the impacts have been delayed but well worth studying. The key policy levers fundamentally alter the state’s land use regulations, or the Minnesota Metropolitan Land Planning Act (MLPA). The alterations eliminated single-family zoning, established form-based zoning guides (general height, size maximums/minimums), and streamlined development by eliminating discretionary review and implementing by-right administrative review using clear, objective standards. The primary importance of form-based guidelines, or “built form districts,” in Minneapolis 2040 is that they function as a by-right standard used to increase density in specific parts of the city, most notably transit arteries. By eliminating single-family zoning in a sweeping policy, the built form districts offer broad guidelines designed to promote rapid redevelopment across the city. Minneapolis 2040 created 14 built form districts as represented in Figure 12. There are four specific areas approved for residential use: Interiors, Corridors, Transit, and Core. In the place of single-family zoning, an Interior 1 district lot may have up to three separate dwelling units (ADUs, houses, triplex), be up to 2.5 stories tall, and may not be combined with other lots. These areas can still contain single-family homes. Interior 2 begins introducing lot-combining and lots with more than three units. Interior 3 and Corridor 3-4 reflect smaller units but do not mandate buildings taller than one story. The introduction of the Corridor district designates neighborhoods in transit routes that are surrounded by Interior 1-3 districts. Corridor districts are designed to facilitate higher density, narrower streets, and cohesive transitions between residential, commercial, and transit use. Corridor 6 marks a key transition for Minneapolis’ urban progression. Corridor 6 mandates multi-story buildings, forcing mixed use and high density in high frequency transit areas just peripheral to downtown. Capped at a max height of six stories, these neighborhoods are meant to organize Minneapolis’ population concentration around transit nodes surrounding the city while offering a distinct gradient between residential dominated neighborhoods and downtown. Transit 10 and 15 mandate building heights between 2 to 10 and 3 to 15 stories, respectively. The first two of the transit districts are adjacent to major metro stations and are not radical deviations from the taller corridor districts designed to funnel populations toward transit routes. Transit 20 then ranges from 4 to 20 floors while Transit 30 ranges from 6 to 30 floors. These two districts must set back upper floors to increase light and air presence in the city. Transit 30 represents an aggressive transition to a proper downtown environment with recommended minimum height being 10 floors. The final housing district is the downtown business district, Core 50. Building heights are a minimum of 10 stories with no maximum. Supporting the largest segment of Minneapolis’ economy, the area’s population also fluctuates with office buildings as a core anchor.
Figure 12: Minneapolis Built Form Map (Downtown)
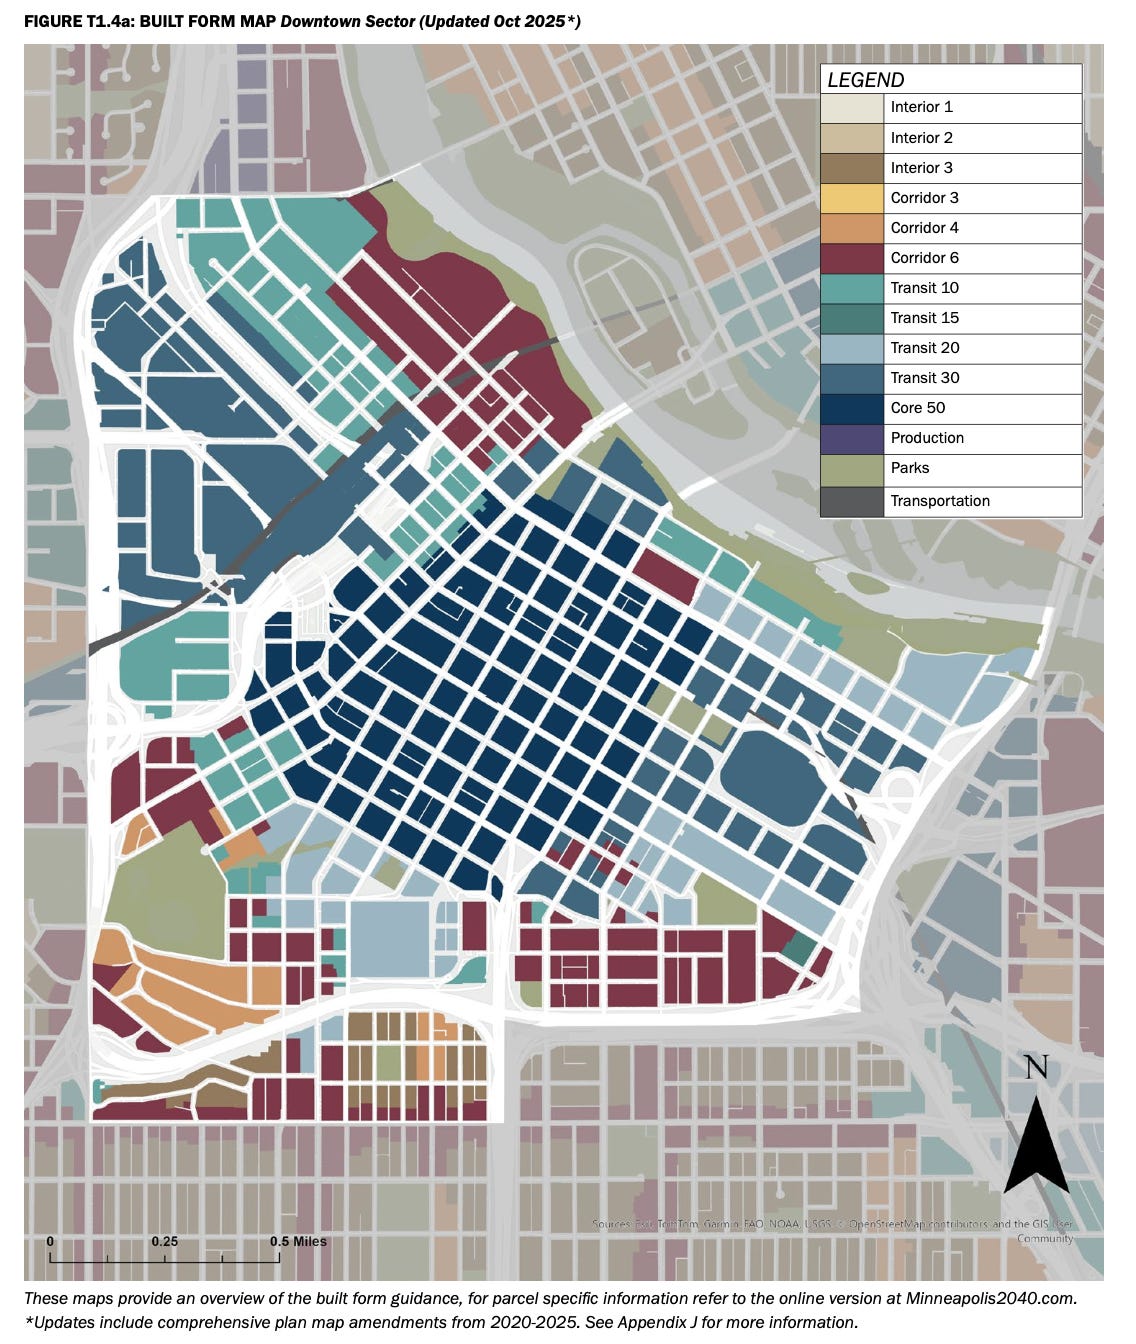
The exhaustive list above is remarkable as it not only replaced a pervasive single-family zoning regime but created an administrative, by-right approval system in which the Interior, Corridor, Transit, and Core developments require simple administrative approval to complete the initial zoning permit process. The two barriers to rollout here are environmental review that is highly discretionary and any significant deviation to approved zoning guidelines, both of which are increasingly common as building size increases. The radical simplicity of the zoning is still slowly being accepted with regulators working out approval mechanics and relationships with developers. In terms of urban infill, this policy is starting to take off but nation-wide construction slowdown limited the speed of development. Parking structures, vacant lots, and commercial strip conversions into six floor apartment complexes near transit hubs are currently planned across the city. As we will also see in our next case study, the most rapid housing increases concentrate on ADU, duplex, triplex, and fourplex additions or conversions on former single-family zoned parcels. Figure 13 from the Federal Reserve Bank of Minneapolis, a key data auditor of Minneapolis 2040, reflects the permitting climate of multifamily retrofits since passage. Since the policy became law in 2020, total development of multifamily properties have slowed in four out of five years compared to 2019. Conflict over the legality of Minneapolis 2040 certainly deterred developers from aggressive investment but the permitting data is not indicative of consistent growth correlated to the new Minneapolis 2040 policies. The increased conversion of single-family parcels is interesting to note however as it indicates that Minneapolis 2040 directly challenged the city’s failure to upzone any single-family lots. This trend may drive densification of Minneapolis and offer unique insight into eliminating urban single-family zoning.
Figure 13: Multifamily Building Permits in Minneapolis on Formerly Single-Family Zoned Lots
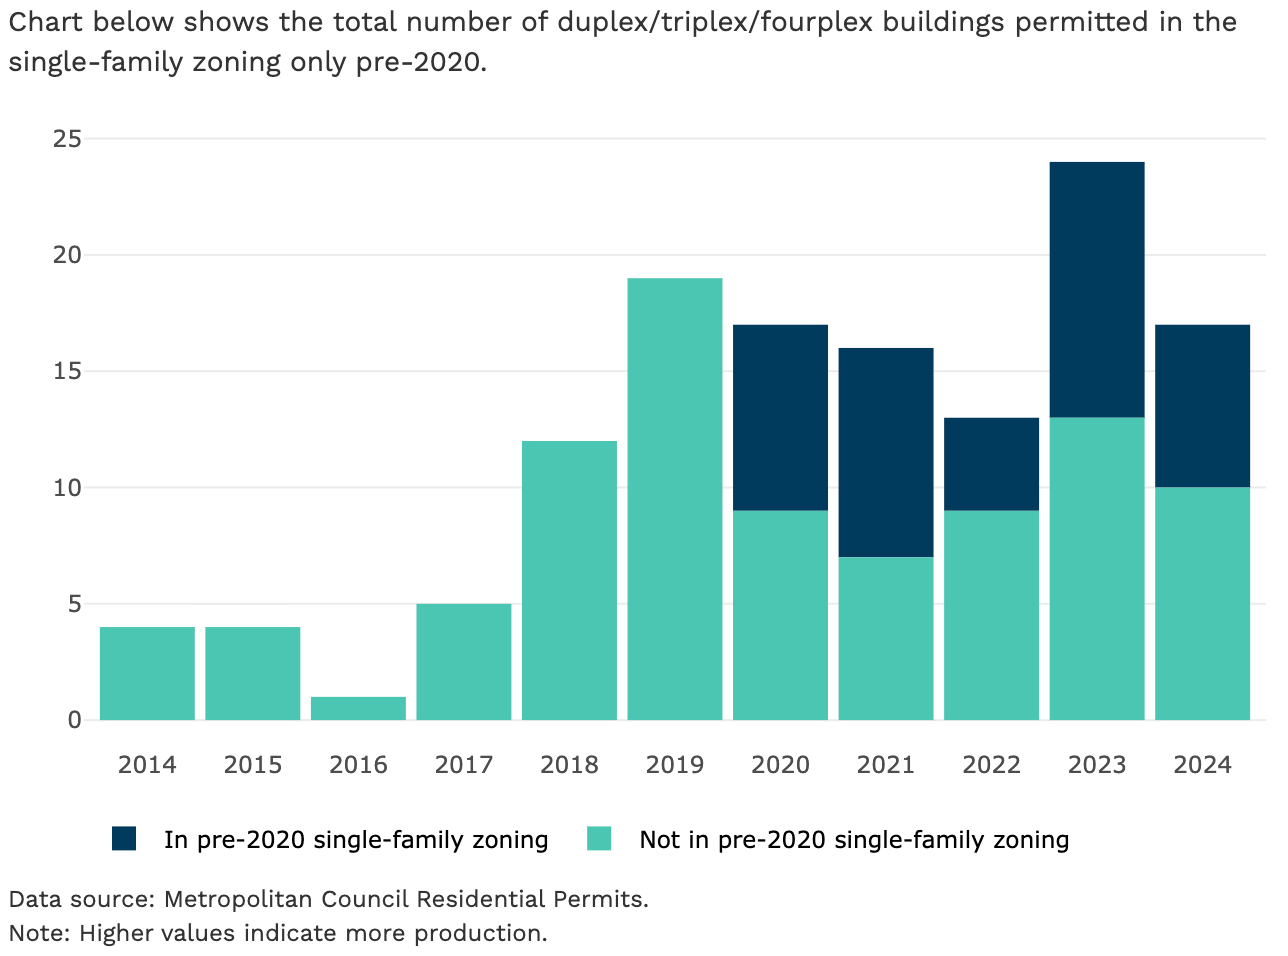
When analyzing Minneapolis’ new affordable housing construction compared to St. Paul (as a Minnesota urban reference) and other American urban markets, interesting, at times contradictory trends emerge in affordability, volume, and consistent growth. Figure 14 from the Federal Reserve Bank of Minneapolis reflects the construction of new housing units at varying price levels representing area median income (AMI) percentages. On affordability, Minneapolis outperforms both Minnesota counterpart St. Paul as well as national averages in delivering a range of affordable units, especially since the passage of Minneapolis 2040. Consistently delivering hundreds of units at or below 30% of area median income, Minneapolis displays remarkably consistent development for poor communities while the national market has only shown progress in advancing affordable developments in the 30%+ to 60% of area median income.
Figure 14: Affordable Housing Construction by Unit Price in Minneapolis, St. Paul, and Averaged U.S. Urban Centers
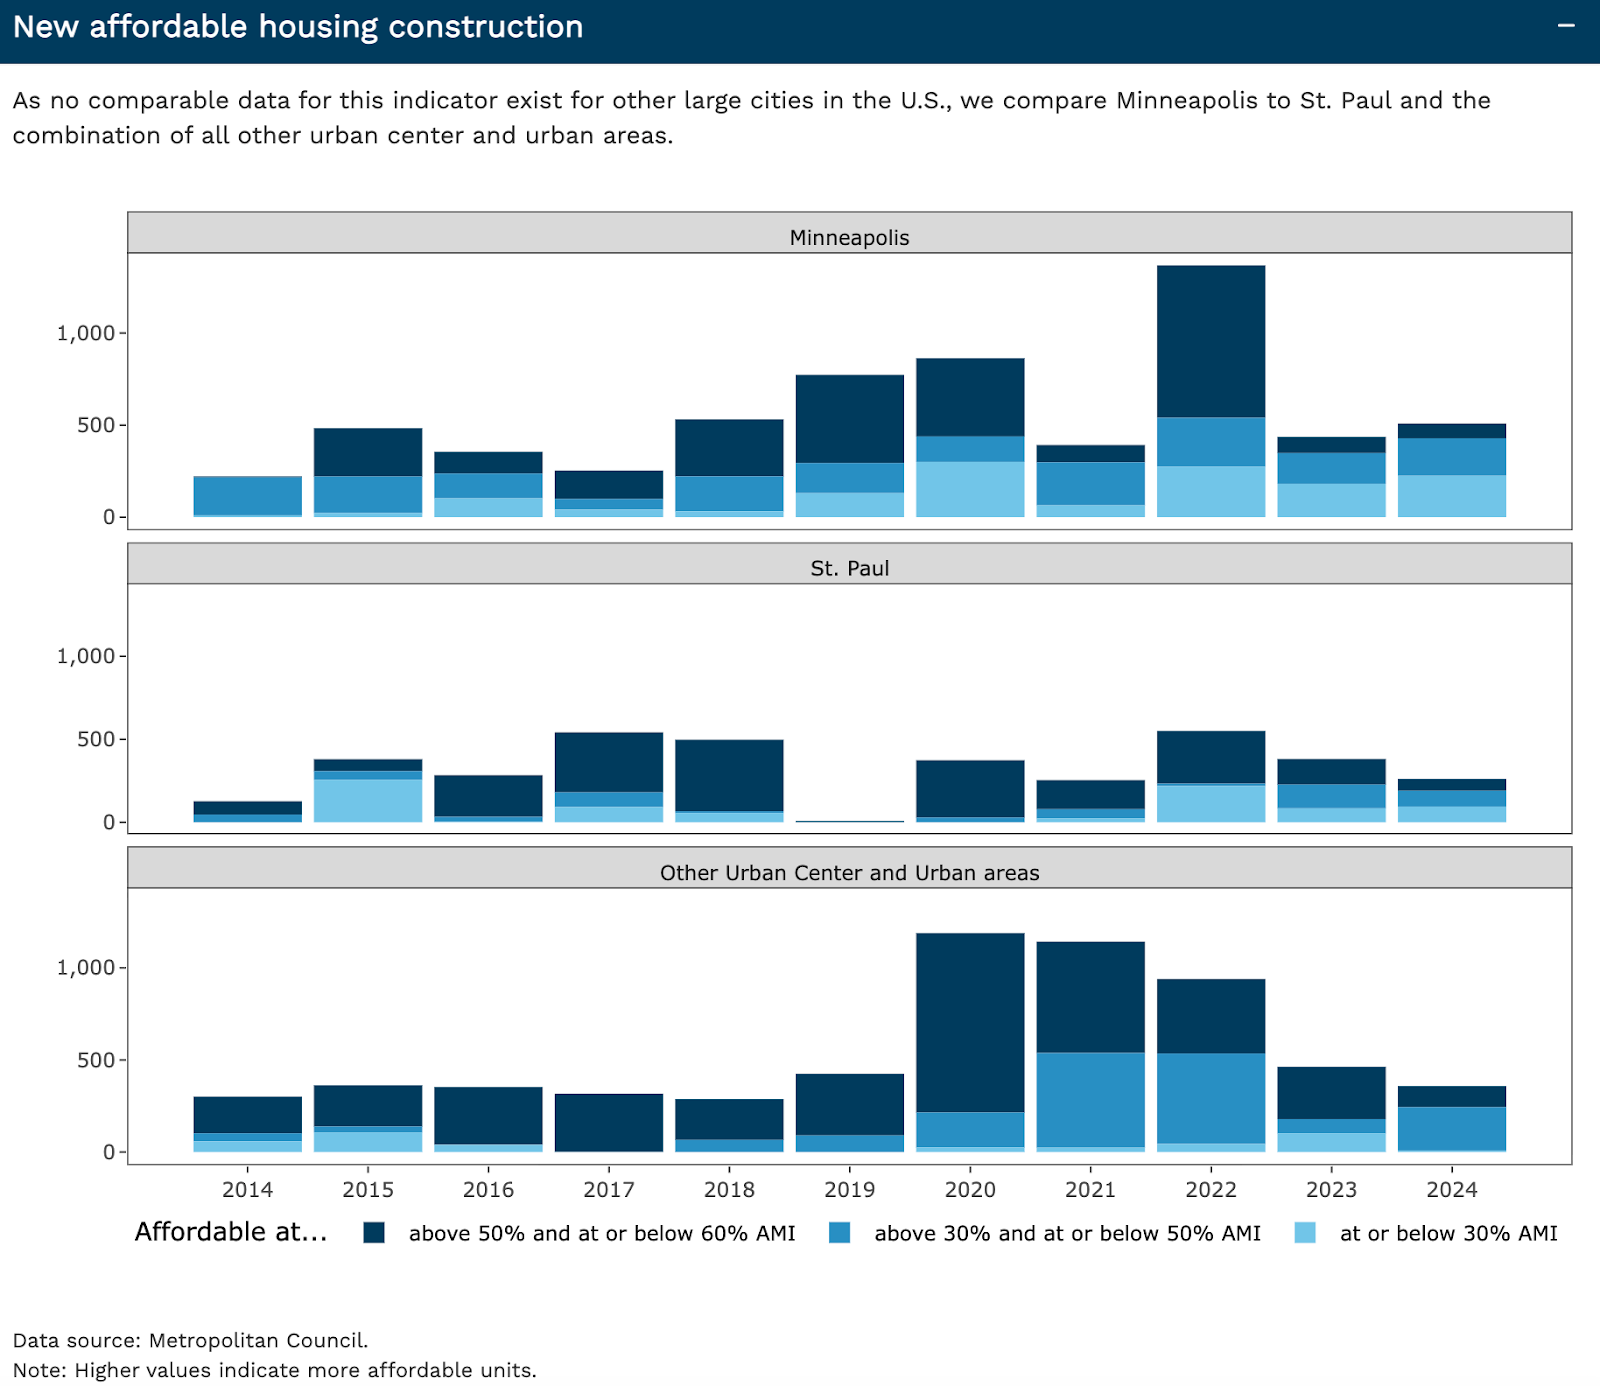
Affordable housing development across lower incomes is crucial but the return on investment on more expensive units motivates cities like New York City, Boston, and other markets to permit affordable, but profitable units. Interestingly, the expensive units deliver more consistent volume as represented by the “Other Urban Center” and Minneapolis from 2020 to 2024. The average American city delivered sustained development while Minneapolis operated in a boom and bust cycle with multiple annual drawdowns exceeding 50% year over year. Not limited to Minneapolis, the average urban center category endured a similar drawdown from 2022 to 2023. Where cities choose to concentrate consistent housing growth appears to be the defining separation in this analysis between Minneapolis and the rest of urban America. By prioritizing bottom 30% AMI units as their base of development, Minneapolis sacrifices stable growth of the overall construction ecosystem but rapidly increases the stock of very affordable housing. In boom years, Minneapolis commercializes more expensive units rapidly as well, capitalizing on a positive investment climate to also accelerate total housing stock. Meanwhile, the average American city uses the expensive categories of “affordable housing” to meet legal or fair housing obligations but rarely invests in the 30% or below AMI category. Here we can see a disconnect from how Minneapolis and the rest of the country think about housing through affordability, volume, and consistent growth. Minneapolis is willing to endure slower total growth at times to provide sustained development of low AMI units while other cities prioritize consistent growth with little to no attention paid to units at 30% AMI. The tensions here are clear and Minneapolis’ permitting ecosystem has not outperformed other urban cores outside of the remarkable emphasis in sub-30% AMI units. More time is needed to monitor the overall ecosystem health of Minneapolis’ housing development, but priorities seem to have shifted dramatically toward very poor residents compared to the national average.
California ADU policies over the last decade utilize both by-right approval and pre-approved building designs to great effect. Several pieces of legislation passed between 2016 and 2023 layer on top of each other to create a remarkably robust policy stack supporting homeowners, developers, builders, and consumers pursuing affordable housing.
AB 2299 (2016) fundamentally altered the development landscape, allowing ministerial approval of ADUs, banning owner-occupancy mandates, and limiting both fees and approval timelines used to stall development. AB 2299’s by-right approval clauses required local agencies to specify objective building standards and barred local agencies from organizing discretionary hearings on ADUs. SB 1069 furthered by-right development authority by eliminating parking requirements on ADUs that were used as a tool to limit their construction. The state, under Governor Jerry Brown made the decision to guide housing policy at a state-level, bypassing the varied interests of local zoning authorities and city governments. In 2017, AB 494 addressed a frequently exploited local veto tactic by enacting by-right approval of all ADU conversions of garages and basements. In 2019, a package of bills (AB 68, AB 881, and SB 13) barred several specific zoning regulations used locally to ban ADUs, extended ADU protections to smaller units, and decreased the approval timeline with a deemed approval provision for lapsed judgements. AB 68 prohibited local governments from zoning out ADUs using minimum lot sizes, coverage ratios, and floor area ratios. AB 881 provided ADUs under 500 square feet the same legal protections afforded to traditional ADUs. SB 13 was the truly monumental policy of the 2019 triumvirate, installing deemed approval for ADUs and reducing the approval window by 50% from 120 days to 60 days. In 2020, AB 3182 took the fight for ADUs further, prohibiting HOAs from banning ADU development and renting, overturning a pervasive veto tool used by California’s private communities. These numerous legislative policies were important to codify the rights of single-family parcels to build ADUs, but truly industrializing the development of ADUs came from the pre-qualified build policy lever.
In 2023, California passed AB 1332. AB 1332 required applications to be approved within 30 days of submission, a 50% reduction from the new ADU review timeline enacted in SB 13 just four years earlier. The bill also required local approval agencies to generate pre-approved ADU designs. These designs are pre-vetted through zoning and building codes and require a small fee to use, paid to local agencies. Pioneered first in Los Angeles, the now state-wide policy mandated a range of pre-qualified plans including studios, one bedroom, and two bedroom units of various sizes. While not compatible with every single-family lot statewide, the development of locally dictated ADU plans streamlines previously discretionary approval and simplifies opaque timelines for developers and homeowners. The results of these policies have been truly staggering.
In 2016, the year Governor Brown signed off on ministerial approval for code compliant ADUs, California issued just under 1,200 permits. One year later that total jumped over 400% to 4,800 permits issued. The legislative adjustments addressed growing housing demand, but how did the additional legislation closing loopholes and accelerating development through pre-approved builds change permitting? In 2021, more than 20,000 ADU permits were issued for immediate construction. Permit issuance steadied at around 25,000 permits a year through 2023 after which the preapproved builds were authorized. Preliminary data for 2024 and 2025 indicate a minimum of 10% growth per year, driven chiefly by dense southern California cities like Irvine, Los Angeles, and San Diego. We can conservatively say that California has reached 30,000 ADU permits issued per year, a remarkable 2,500% increase in just 10 years. Still an urban sprawl, Los Angeles communities worked within their constrained resources to rapidly increase housing stock. Now generating almost half of California’s annual ADU permits, the city of angels is the model for ADU policy, nation-wide.
Timeline Impact
Minneapolis 2040 is a newer policy that suffered extensive legal delays. Therefore, accessing data is difficult and rendering judgement on a program less than 25% of the way through its targeted timeline is unfair. For that reason, we will make general assessments with these facts in mind, relying on data from California’s ADU program for a fuller picture on the success of by-right approval and pre-approved builds on accelerating development timelines.
Minneapolis under Minneapolis 2040 is a radically different permitting environment. Discretionary permits are down significantly as a result of increased by-right approval authority across the city. Permitting for affordable units is also accelerating significantly but overall permit issuance appears to be declining by as much as 25% from 2023 to 2024. Unfortunately for this analysis, Minneapolis 2040 does not have enough data to claim early success and city departments have not released meaningful updates on housing supply or permit issuance. By law, the permitting timeline in Minneapolis is now just 20 days, making it one of the quickest urban review processes in the country. For timeline impact, Minneapolis 2040 is impressive in developing housing for poor communities but is so far unproven in radically increasing housing stock and reducing development timelines.
For California, the time limits on ADU development proved transformative. Prior to AB 2299 and SB 13, local regulators could manipulate ADU permitting to wait out developers. With AB 2299 and SB 13, homeowners and developers hold approval committees and cities accountable to clear standards and tight timelines. The approval timeline was set to 120 days in 2016. By 2023, the approval timeline was reduced to just 30 days. California’s legislature prioritized swift ADU development and met the challenge annually with new regulations bolstering the cause of densification. With clear costs, regulatory standards, and closed loopholes, regulators had no way of denying developers through discretionary means. With the standardization of pre-approved builds, homeowners also bypassed high-friction interactions between architects and regulators disputing building codes and zoning. Further, SB 13 (2019) dramatically reduced local jurisdictions’ ability to employ cost-prohibitive fees and owner-occupancy requirements designed to delay development. From 2016 to today, the true word to describe the ADU building environment is transformative. Policies have democratized ADU development in such a manner that you could consider it a right of California citizens. Not only did the state step in to mitigate a housing shortage, they bolstered individual rights of Californians by radically reducing overly-bureaucratic timelines.
Cost Impact
Minneapolis 2040 is a newer policy that suffered extensive legal delays. Therefore, accessing data is difficult and rendering judgement on a program less than 25% of the way through its targeted timeline is unfair. For that reason, we will make general assessments with these facts in mind, relying on data from California’s ADU program for a fuller picture on the success of by-right approval and pre-approved builds on improving housing affordability.
As Minneapolis 2040 combines several distinct policies into a comprehensive reform plan, it can be difficult to separate out cost impacts. Elimination of discretionary review is the major cost change here. Developers save hundreds to thousands of dollars on small developments or tens of thousands of dollars on large developments by avoiding costly delays and assessment periods. Savings here are impactful, ranging from $800 on the low end in ADUs to over $50,000 on the high end in larger apartment developments. Additional cost savings were included in Minneapolis 2040 but fell out of scope of this work.
The additional measure of pre-approved templates is the key to understanding the relevance of California ADUs’ impact. Using these templates, developers save, then pass on to renters/homeowners, $11,000-$22,000 in savings. ADUs benefit from unprecedented policy-initiated development savings by eliminating architect fees and reducing permitting timeline costs. In high regulation markets like San Jose and Palo Alto, this impact is even more substantial, potentially saving $25,000 to $60,000 on development cost.
Risk Mitigation Strategies
A particular risk for By-right Zoning for Pre-qualified Builds policies is the urban “donut effect.” The phenomenon describes urban upzoning occurring only in the outer, peripheral neighborhoods of a city while the central core remains low-density and exclusionary. The donut effect often occurs when upzoning and by-right zoning is only approved in commercial or transit corridors. The politically convenient nature of only passing by-right zoning in less affluent or commercial neighborhoods fails to address city-wide housing deficits. Affluent, single-family zoned urban communities reinforce economically segregated cities in which housing supply remains constrained as poor neighborhoods are defined by small lots and multifamily housing. The solution here is straight-forward. City-wide upzoning or by-right approval is far more efficient in improving city-wide housing density and reducing economic segregation.
The niche, cultural method to prevent housing density increases in cities already zoned for multifamily housing (think increasing a lot from 10 units to 40 units) is through historic zoning overlays forcing extreme discretionary review on individual development projects. Discretionary stylistic review is a niche but extremely potent threat to densification policies. The optimal policy tweak to avoid the stylistic discretionary gridlock is pre-qualified builds negotiated in thorough detail with relevant permitting bodies. Pre-qualified builds offer a more substantive counter to form-based code overlays, a policy layering loose, local architectural requirements over already intense discretionary regulations. By spending several years to formalize a historically significant neighborhood’s housing code into approved templates, developers and residents gain reassurance of their shared cultural commitment to each other. By considering historical, culturally important stylistic elements through collaboration with preservationists, urban density advocates also weaken NIMBY coalitions who weaponize historic preservation to prevent upzoning.
The strongest safeguard that must be in place is proper environmental consideration prior to building. Minneapolis 2040 was halted for a period to reassess environmental impacts the project had not properly reviewed prior to passage. While Minneapolis 2040 is a large, cumbersome batch of reforms, it aimed to simplify city development for the next several decades. California’s bursts of ADU reform are similar. While far more precise, the collection of legislation mobilizing the greatest roll-out of ADUs ever seen in the United States is almost libertarian and environmentally negligent in nature. By simply handing over the right to develop any pre-approved structure through by-right zoning, the state of California and city of Minneapolis increase hazards such as fire risk, strain on municipal systems, and potential for overcrowding. These narratives have historic parallel, New York City in the late 1800s is an excellent retrospective example. Disease and disaster from overcrowding were commonplace. We are far from the lack of regulation that defined this era of construction, but overcrowding of a horizontal plane (think the rolling one-story urban sprawl of Los Angeles) can increase disaster-likelihood, especially in wildland-urban-interface zones prone to wildfire.
Statutory Environmental Exclusions for Infill and Transit-oriented Development
Statutory Environmental Exclusions exempt certain classes of development projects from standard environmental review under the rationale that specified projects have minimal environmental impact and meet a high-priority, often crisis-level need (in this case urban infill for transit-oriented communities).
Policy Mechanism
Bypassing environmental review is a weighty policy with powerful ramifications. The essential mechanism is a law superseding existing state and local environmental review criteria. Environmental review exclusions allow developments meeting predetermined qualifications to bypass discretionary project impact studies, agency reviews, as well as public review and comment periods. These exemptions can be “categorical,” meaning they can sometimes be challenged, or “statutory,” meaning they are written directly into law, which provides a much stronger and more certain legal protection against challenges. We made the decision to recommend statutory exclusions as it better fits the stated goals of improving both development speed and affordability. Exclusions can also include a sunsetting date at which time the exclusion is removed and environmental reviews are reinstated.
Exclusion policies are directed primarily at state laws like the California Environmental Quality Act (CEQA) or New York’s State Environmental Quality Review Act (SEQRA). While well intended and historically impactful, environmental review policies are now manipulated against multifamily or large apartment developments in urban cores. As explored throughout this report, developing multifamily units in highly regulated cities is cost-prohibitive as nebulous approval timelines levy additional cost in financing, material, and labor contracts. Typical environmental review then opens a window for time-consuming legal challenges that drain developers financially though legal fees and overhead on financing, material, and labor contracts. Development languishes in these extended entitlement periods, spooking investors, tarnishing political relationships, and casting immense financial uncertainty over projects. The abuse of environmental review for transit-oriented infill is especially harmful as these projects build on previously-developed sites that have decayed or not grown alongside increasing use of public transit. The specific exclusion from environmental review discussed in this section is designed to maximize density along transit corridors, efficiently optimizing city expenditures on public transit. The recommendations in this section do not advocate for the abolition of environmental review. Instead, statutory environmental exclusions retain government-developer communication while reducing NIMBY-style abuses of environmental review using frivolous lawsuits and stalling.
Qualifiers for exclusion are usually extremely specific. Frequent qualifiers include proximity to a public transportation stop, parcel and building size maximums/minimums, proximity to wildlife habitats (usually coastal) or environmental hazards (floods/wildfires), and specific density or affordability criteria. Substantively, this is where local lobbying and political discussion guides the specifics of policy. It is important to note that bypassing environmental review does not mean that developers also bypass standard permitting processes that can be equally tedious in the entitlement phase. Some policies enacted in American states combine environmental exclusion with ministerial or by-right zoning approval. For the sake of not repeating policies or outcomes in the Permitting Approval Time Limits with Deemed Approval Provisions section, we will only focus on policies that bypass environmental review and not zoning.
Case Studies
Passed in 2025, California’s AB 130 and SB 131 offer a fascinating case study of both why statutory/categorical environmental exclusions are growing in popularity and how to implement them. Unfortunately, AB 130 and SB 131 do not analyze transit-oriented development, instead focusing on urban infill and its relation to CEQA compliance. For a transit-oriented case study, we will focus on Washington state’s recent environmental exclusion policies. California recently passed SB 79 (2025), establishing minimum upzoning for areas located within a half mile of publicly-funded transit stops. While we will not analyze SB 79, it could layer on to the reforms of AB 130 and SB 131 to attain by-right zoning and a statutory CEQA exclusion. The recent passage date of AB 130, SB 131, and SB 79 will also prevent any analysis of the bills’ immediate effects. While environmental exclusions are a relatively new policy, analyzing their potential impact in California provides value. The additional case study analyzing Washington state’s experimentation with exclusions is also offered to give a novel, transit-focused case study for readers to track in the future.
AB 130 encodes several changes to development procedures. Public hearings are now capped at a maximum of five across the state while the California Coastal Commission must comply with permitting approval time limits, closing a persistent loophole used to regulate urban coastal development. Most importantly though, AB 130 creates a statutory CEQA exemption for any project that sits in a defined urban municipality, meets general zoning or planning ordinances, and meets a minimum density of 10-30 units per acre. Projects still conduct a Phase I CEQA Environmental Site Assessment and complete any relevant mitigation. SB 131 works to facilitate edge-cases into the new exemptions established by AB 130. Housing development permits that were disqualified from CEQA exemption under a single condition are now given a conditional exemption from further CEQA-related delays if they correct said violation. In theory, SB 131 revives thousands of projects killed by CEQA. In reality, SB 131 will likely require further amendment to clarify differing interpretations. SB 131 also requires the state government to digitally map all eligible urban infill sites for developers to access with updates every two years, a useful but poorly-constructed temporal cadence for recurring analysis.
More widely applicable than a transit-only exemption, AB 130 provides near-complete statutory exemption for all urban infill projects up to 20 acres (sometimes several city blocks in size). Affordability requirements are limited, giving developers more flexibility in planning. Unfortunately, the lack of focus on affordable housing will likely contribute to trends of gentrification and displacement of low-income urban populations. The changes to CEQA dramatically alter how developers structure their entitlement planning. Approval timelines are not only condensed but incredibly more direct, CEQA’s relationship to developers is now simplified into a general planning check with virtually no opportunity for discretionary delay tactics. From a legal perspective, this change removes the highest risk exposure developers endured in California’s entitlement phase.
AB 130 and SB 131 are not perfect solutions to CEQA reform. The two bills are large carve-outs to facilitate rapid permitting of urban densification projects. Further reform will be required to ultimately prevent discretionary manipulation of CEQA requirements but AB 130 and SB 131 should both accelerate short-to-medium-term development in urban areas. An important question should be how these two reforms interact with SB 79 in reality. It is unclear if politically-adept developers will attempt to layer CEQA exemptions of AB 130 into automatic upzoning codified in SB 79, effectively creating by-right zoning and environmental review approval.
Washington state is governed under a similar environmental review process to California, the State Environmental Policy Act (SEPA). Washington has an additional layer of governance, the Growth Management Act (GMA), that requires cities to estimate their future population growth and create localized plans for how they will accommodate said growth through housing development. GMA is a unique policy blending the mass-organization tools of Minneapolis 2040 and statistical analysis of California’s RHNA. A unique facet of GMA is that it requires designation of urban growth areas (UGAs) where development must occur, a policy intended to prevent suburban sprawl and preserve agricultural/forestry lands. If population growth occurs too quickly only small accommodations are allowed for spill-over. In our view, UGA policy will inevitably lead to some level of a housing bottleneck, but it does pressure cities to develop vertically instead of allowing sprawl.
RCW 43.21C.229 is a statutory exemption passed in 2025 allowing cities, if they choose to implement the exemption, to bypass discretionary SEPA review for residential, mixed-use, and commercial infill development. Cities only qualify for the exemption if they fail to meet their predetermined housing estimates in GMA reporting. If the city chooses to enact RCW 43.21C.229, they must conduct and publicize an environmental impact statement for specific infill areas analyzing potential adverse impacts from development. This environmental impact statement serves as a rubric for objective approval in subsequent exemption applications. In essence, the city government completes a SEPA evaluation for entire lots they believe could be redeveloped then passes the report on to interested developers. Developers then use the city-specific remediation requirements in their applications, demystifying subjective environmental review. RCW 43.21C.229 also provides automatic for SEPA exemptions to developments meeting “Middle Housing” qualifications (duplexes, triplexes, fourplexes, fiveplexes, sixplexes, townhouses, stacked flats, courtyard apartments, and cottage housing). At a practical level, RCW 43.21C.229 enables cities to aggressively shape their urban development by incentivizing rapid entitlement approval on unused or vacant lots. The city can also create a blanket, city-wide environment impact report for developers. As previously mentioned, this blanket report effectively provides a boilerplate for developer environmental impact statements, facilitating a swift statutory exemption.
Washington also passed HB 1491 in 2025. The legislation focused on a range of multifamily development zoning issues and incentives, including a 20-year property tax exemption for new developments. Most interestingly though was a small clause providing categorical SEPA exemption if the development was mixed-use and within ½‑mile walking distance of a rail station or within ¼‑mile of a bus rapid transit stop. HB 1491 offers a dual incentive to developers by reducing property tax burden and SEPA requirements. Additionally, new developments taking advantage of these benefits must provide affordable housing units meeting one of the following requirements: 1.) at least 10% of the housing units must be rental housing units affordable to families making 60% or less of the Area Median Income (AMI), or owner-occupied housing units affordable to families making 80% or less AMI; 2.) at least 10% of the housing units must be rental occupied units affordable to families making 80% or less AMI if at least 10% of the total units in the building have more than 2 bedrooms; or 3.) at least 20% of the units must be rental housing units affordable to families making 80% or less AMI. The additional requirements should not significantly impact development feasibility while increasing overall affordability of Washington urban housing. So far, these policies (RCW 43.21C.229 and HB 1491) are too new to evaluate any direct impact on housing development but do directly attack the lengthy administrative, legal, and public opinion delays synonymous with environmental review.
Both California and Washington’s experiments with environmental exclusion policies are freshly passed and have yet to make tangible changes to the state’s development culture. While California opted for a highly combative policy tone, radically reducing several regulatory agencies’ authority, the state may not have gone far enough. While progressive and ambitious, AB 130 and SB 131 fail to drive transit-oriented development in the targeted way that SB 79 does. While AB 130’s broad CEQA exemption for infill does push forward large-scale urban densification, conservationists raise fair concerns on the environmental trade-offs of rapid development. Both AB 130 and SB 131 will likely face some legal challenge in the legislature or in courts as many pundits and policymakers view the reforms as rushed and heavy-handed. Washington’s RCW 43.21C.229 is exceptionally important. The policy relies on cities to be proactive in collaborating with developers, a frequent point of policy failure across the United States, but does usher in a unique emphasis on public-private collaboration on densification. It will be important to track how cities choose to engage with RCW 43.21C.229 as it is implicitly anti-NIMBY. Some cities may choose not to invoke the policy if constituents are resistant to densification. HB 1491 goes further on collaboration by offering formal tax incentives if developers push through densification in transit arteries. HB 1491’s emphasis on affordable housing access is also crucial to note and likely pays for itself through developer tax incentives. For both California and Washington, public-private densification policy will likely face massive NIMBY opposition. Remaining steadfast in the ambition of expanding housing supply must replace decades of policy weaponizing environmental protection as a means to limit housing supply growth.
Timeline Impact
AB 130, SB 131, RCW 43.21C.229, and HB 1491 were all passed last year with HB 1491 still not in effect. Given this situation, tangible data on changes to permitting timelines is limited. Instead, we will offer insight on what citizens in California and Washington can expect from these policies moving forward.
AB 130 condenses the CEQA process dramatically, reducing the environmental-entitlement phase to a simple site assessment with no litigation or public hearing vulnerability. The procedure is tight with a bounded timeline defined by objective review standards and a single site study instead of endless discretionary rulings, hearings, and delays. For urban infill projects, observers can expect a radical transformation. CEQA is notorious in California for delaying developments. Timelines usually range between 1-3 years but often extend beyond that due to complexities of urban development and California’s harsh regulatory environment. Urban infill frequently hits the four year mark due to remediation concerns. While each site is bound to have varying levels of remediation required, the California legislature is claiming that CEQA has overexerted its regulatory authority. Total urban infill entitlement timelines may reduce by 6-9+ months in cities with extreme zoning regulation.
SB 131 narrows how developers engage with CEQA. Instead of reanalyzing development sites following successive mitigation projects, developments are only reanalyzed on CEQA failures from their first review. While this development timeline impact is more difficult to gauge, we can identify significant process changes introduced by SB 131. Creating a focused CEQA process that does not reopen analysis upon successive submissions dramatically lowers the risk developers incur when interacting with CEQA reviews. Litigation is minimized, consulting contracts are eliminated, and total CEQA approval timeline schedule is reduced. The total timeline impact is, once again, difficult to exactly quantify but SB 131 should provide both greater volume of CEQA approvals and a slight timeline reduction of a few weeks to a month. Some projects will benefit greatly though as this bill restores many disqualified developments retroactively.
In Washington, RCW 43.21C.229 accelerates urban infill by coordinating a city-level response and template to SEPA requirements. In a novel coordination of intent, cities and developers are working together to bypass excessive environmental review. The city front-loads a majority of SEPA compliance work in a parcel or city-wide environmental report given to developers to use as a guide in their environmental impact assessment. The city actively eliminates expensive consulting fees SEPA previously required development firms to pay, reducing development timeline and cost. Once the initial assessment is confirmed via SEPA, the development bypasses any further interaction with SEPA regulators barring local appeal. Similar to California, SEPA authorization processes typically range from 1-3 years. RCW 43.21C.229 should reduce this timeline by several months for infill developments.
HB 1491 attacks similar points of dysfunction in SEPA and zoning while incentivizing developers through property tax write-offs. Parcels in close proximity to transit routes cannot block density increases, even if the parcel was zoned for single-family housing only. This automatic upzoning reduces a significant point of delay for developers in the entitlement phase: petitioning for zone changes or special use permitting. Timeline reductions here are significant, likely on the order of months to a few years. Similarly, transit-oriented developments receive categorical exemptions through RCW 43.21C.229(5). This alteration removes SEPA documentation, comment, and appeal periods, likely reducing developer timelines by a further 3-4+ months. Cumulatively this means that Washington state may reduce their development timeline by 6+ months.
Cost Impact
AB 130, SB 131, RCW 43.21C.229, and HB 1491 were all passed last year with HB 1491 still not in effect. Given this situation, tangible data on cost reduction is limited. Instead, we will offer insight on what citizens in California and Washington can expect from these policies moving forward.
CEQA reductions have two very specific cost impacts. Environmental review imposes uncertainty on development timelines, increasing carrying cost. Simultaneously, site review, environmental studies, and mitigation are soft costs imposed on developers that are nearly impossible to reliably predict from site to site. AB 130 directly targets these cost impacts by limiting CEQA scope and providing consistent timelines for developers to base their anticipated interaction with CEQA on. Developers need reliable timelines. If allowed to work, AB 130 delivers reliable timelines for urban infill projects. AB 130 also opens up larger infill lots for CEQA exemptions, increasing “buildable” parcels and improving builder flexibility. We anticipate AB 130 will reduce CEQA-related entitlement costs by $100,000+ for uncontested projects and potentially millions for contested projects. Similarly, SB 131 narrows CEQA’s scope, creating a novel version of approval that is dramatically cheaper due to reduced studies and less litigation. Cost savings here are less dramatic as review, mitigation, and studies are still required but likely amounts to $20,000+ for small projects. Larger projects benefit disproportionately as they can limit CEQA citations on larger cites, potentially saving millions of dollars.
RCW 43.21C.229 and HB 1491 directly reduce consulting staff, legal fees, and soft overhead costs directly associated with lengthy SEPA engagement and frequent legal challenges. Dollar estimates here are difficult to determine but range in the tens of thousands of dollars depending on project size. The tax exemption in HB 1491 runs for twenty years and may not actually impact developer cost directly. Homebuyers do stand to benefit from reduced property tax bills though.
Risk Mitigation Strategies
It is crucial to note that environmental review procedures exist for a reason. The aggressive exemption policies rolled out in California and Washington could have extreme negative environmental impacts if CEQA and SEPA become rubber stamps and procedural. It is crucial that any environmental exemption is targeted specifically at low-risk areas. One way to legally enforce this is mandating that environmentally sensitive lands like wetlands or high fire-hazard zones are removed from environmental exclusions. There is potential here for continued anti-density legal abuse if language is not specific enough, but safeguards preventing development of dangerous or fragile land are a good tradeoff.
Sustainable Affordability
One of the core focuses of ASAP is a consistent regard for sustainability issues in order to square economic growth with a healthy environment. Housing policy is a frequent point of disagreement between sustainability-focused legislators, think tanks, and society.
Many academic and think tank researchers spend significant time quantifying and estimating the relationship between housing density, energy efficiency, and lower individual/community carbon footprints. Sustainability researchers position densification as the direct counter to urban/suburban American sprawl. Researchers also equate sprawl to habitat destruction. In this analysis, we carefully avoid dichotomous comparisons that weaponize sustainability metrics. While densification is the direct counter to sprawl, housing construction and habitat destruction are rarely coterminous in major cities. A single-family home in Compton and undisturbed forest habitat in the San Gabriel Mountains are not developmentally related. Habitat restoration is possible in cities, but redeveloping an urban space for natural benefit is far more likely to result in a public park or nature preserve than any tangible benefit for endangered species. For this reason, we advocate for the measurable impacts of public transportation instead of the near-universal reliance on automobiles as our chief sustainability metric. As the policy reforms section analyzed, permitting reform increases infill and dense urban development. The policy reforms section also analyzes the relationship between permitting reform, densification, and public transit. In this section, we will analyze the ways that densification, infill, and transit-oriented communities can improve urban sustainability, largely in comparison to single-family homes. We tie these themes together in the Sustainable Affordability section to show that eliminating specific policies abused by anti-densification NIMBY activists can simultaneously improve a city’s sustainability and affordability.
American cities are frequently split by a dense system of highways. The dominant thinking for decades was that highway integration throughout a city reduced surface-street gridlock that dominates cities like Boston and New York City. Highways grew numerous, connecting peripheral suburbs to the urban core and encouraging sprawl to connect the two. As traffic congestion developed on highways, cities and states decided to add more lanes to highway systems. A circular feedback loop, cities added highway lanes while urban sprawl exploded. The last two decades saw a unique academic interest in studying the supply and demand relationship between highway growth and traffic congestion. While the American Road and Transportation Builders Association and the American Public Transit Association advocated for continued widening of highways to increase capacity and meet demand, researchers from Brown University and the Wharton School such as Gilles Duranton and Matthew Turner argued that increasing the supply of roads actually increases public use of roads. Duranton and Turner suggest that “people drive more when the stock of roads in their city increases.” While it may sound counterintuitive at first, the research also found that cities attract more residents as they increase their stock of roads, likely leading to urban sprawl. The relationship is incredibly linear, visually ubiquitous across America, but never guided real policy conversation: increasing supply of roads leads to increased miles driven and resulting urban sprawl. The resulting sprawl did destroy wild habitat such as forests and grasslands over the last eighty years. Attempts by cities to compete with individual automobile travel by offering cheap public transit are misguided. Duranton and Turner found that city investment in public transit growth has little influence on individual contributions to traffic or personal automobile use. The paper referenced, “The Fundamental Law of Road Congestion: Evidence from US Cities,” published by Duranton and Turner in 2011, precisely predicted the rise of congestion pricing as a tool to reduce traffic congestion. Now rolled-out in New York City and up for consideration in Los Angeles, San Francisco, Washington D.C., and Seattle, congestion pricing is the unfortunate policy outcome of two planning failures: 1.) an inability to densify and create walkable, urban communities and 2.) a multi-decade, poorly thought-out commitment to increasing road supply. Congestion pricing is a tool that hurts commuters who would prefer to live in the cities they work in, adding an unreasonable expense to urban populations. As urban sprawl accelerated since 1990, the average annual miles traveled in automobiles for Americans increased 65%. In just three decades, cities slowly stretched the patience of their inhabitants through gridlock, longer commutes, and poor affordability. As America’s cities sprawled, they quietly also contributed to several negative health dynamics closely tied to low-density cities.
Sprawl is not only economically harmful, forcing residents into high spending on automobiles, gasoline, and now congestion pricing fees, it also contributes directly to negative health externalities. Smog, a defining staple of Los Angeles, is the result of small particulates, emitted from automobiles and industry, rising into the atmosphere and settling into a fog-like layer above the city. Exposure to smog and general highway-related emissions directly leads to increased asthma, respiratory disease, and lung cancer as documented by Professor Howard Frumkin. Researchers at the University of Toronto also speculate that higher obesity rates are linked to lower exercise in less-walkable communities. The walkability of a community directly translates to improved cardiovascular health of residents. The health improvements from living in a walkable neighborhood offer a strong justification for urban density programs but how does densification impact energy use?
Structurally, dense urban units are far more energy efficient than single family homes. Often half the size of a single-family home, the energy requirement for heating and cooling an urban apartment is dramatically lower by square foot. Additionally, apartment or multifamily structures are insulated by shared walls, reducing the exterior exposure of the unit to outdoor temperatures. These variations reduce the average energy use of an apartment unit by 30% per square foot compared to single family homes. While more convoluted, utility distribution for energy and water are also far more efficient in dense housing. Sprawling communities often source water and energy from distant providers, requiring extensive and fragile distribution systems with significant efficiency losses in distribution. The sophistication of appliances and buildings do matter. Older buildings are frequently inefficient in distributing heat, poking holes in the concept that all urban apartments are measurably more sustainable than single-family homes.
The above research may not be persuasive to Americans preferring rural or even suburban planning. Rural communities uphold vital American cultural and economic institutions including forestry, recreation, agriculture, energy, and many other fields. Rural communities have their own set of policy issues, often requiring more localized regulation. Similarly, suburban communities are American too. Suburbs provide exceptional value and stability while connecting the mosaic of America together. We do not dismiss these communities’ issues as important, instead opting to explore their sustainable affordability issues separately.
Another wing of environmentalists may object to the policies of urban densification we champion. Sometimes called environmental NIMBYs, these environmentalists oppose all construction regardless of the specific supply and demand conditions. This is not a policy position but a means to jam development through the guise of environmental consciousness. ASAP recognizes the need for sustainability as a core tenant in developing housing, not a reason to end all housing construction.
Conclusion
In this report the American Sustainable Affordability Project dissected what it considered to be the chief issue in urban housing affordability: poor supply. Cities across the United States are limited in where they can expand by geographic constraints such as rivers, oceans, mountains, and natural disasters. Yet, much of America’s urban supply constraint is self-inflicted. Policymakers across the country failed to deliver affordable, healthy, and well-planned American cities. Not an issue of free market versus controlled economy, American cities are simply poorly regulated. The positive? Americans can change their policies.
Permitting is designed to ensure sustainable urban development. Yet, we see the system malfunctioning in real-time. Permitting systems were never intended to be a tool used by NIMBY activists to elevate their property values and shut out multifamily development. We see echoes of America’s 1900s racialized zoning codes in today’s NIMBY policies locking young Americans out of homeownership. In Buchanan v. Warley (1917), the Supreme Court abolished race-based zoning codes as a violation of the fourteenth amendment. The case is an excellent historical example to how far American cities have come but also the historical precedent from which many cities’ zoning codes originated. Cities, maliciously or not, created zoning regimes of large lots, exclusive single-family zoning, and explicit bans on multifamily housing that prevented poor, minority, or immigrant groups from urban homeownership. Informal redlining, or the practice of race-based housing discrimination in lending and renting, dominated American housing markets for decades and enforced similar housing inaccessibility. NIMBYism is not inherently tied to these explicitly racist historical examples, but does use many of the same underlying tools to restrict supply. Unfortunately for young Americans, the negative externalities of NIMBY-activism limits the construction of affordable housing that would exponentially increase the number of first-time homeowners.
Twenty-first century cities in America must eventually outgrow the need for single-family homes. While this means that homeowners will see their neighborhoods change, it is past time that the American dream of economic mobility ensures its cities are financially accessible to citizens of all ages.